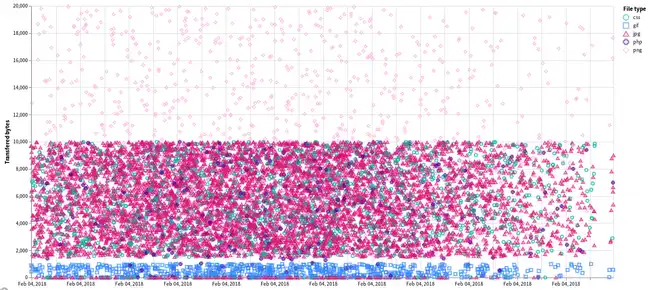
Vega Scatterplot Kibana visualization
A scatterplot visualization made with Vega Lite for Kibana

Get content for Kibana, Elasticsearch, Logstash and more
Elastic Content Share
You searched for "Vega visualization"
A scatterplot visualization made with Vega Lite for Kibana

Vega example to show GitHub commits per author per hour of day.

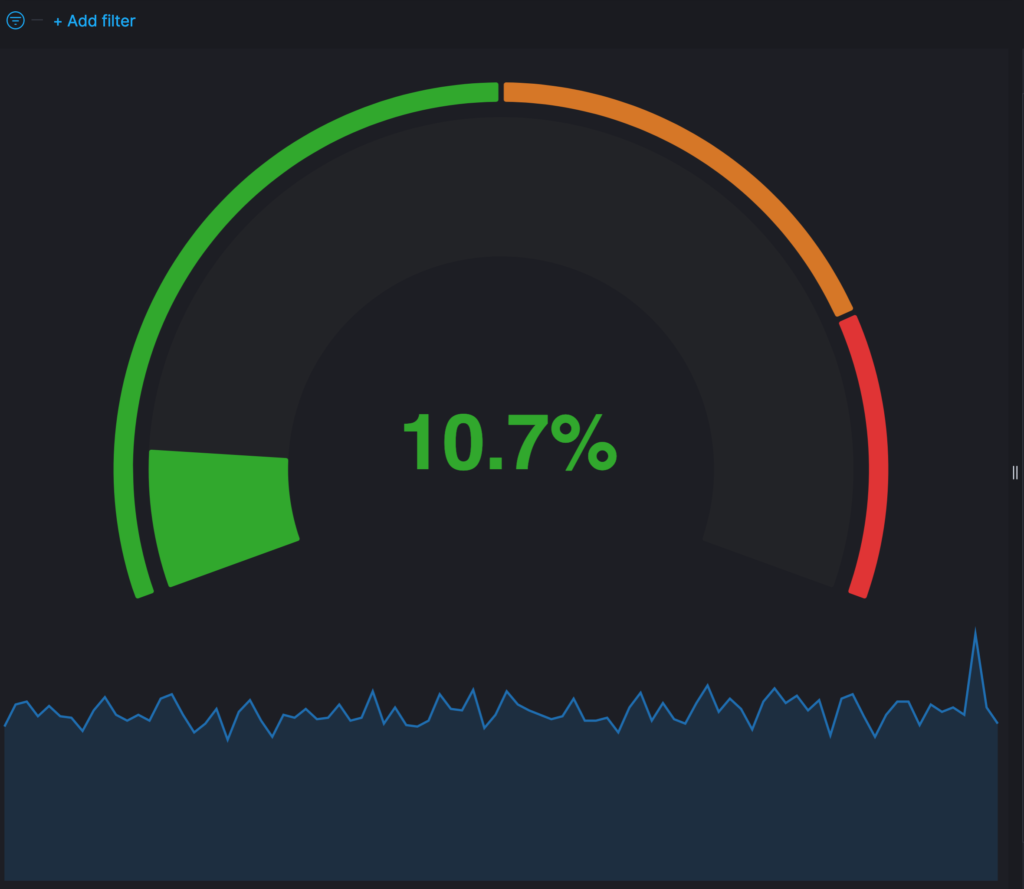
This is a compund gauge visualization made with Vega. Its very helpful for visualization of percentage values.

This traffic light visualizations is build with vega. The thresholds can be defined via values within the document itself.
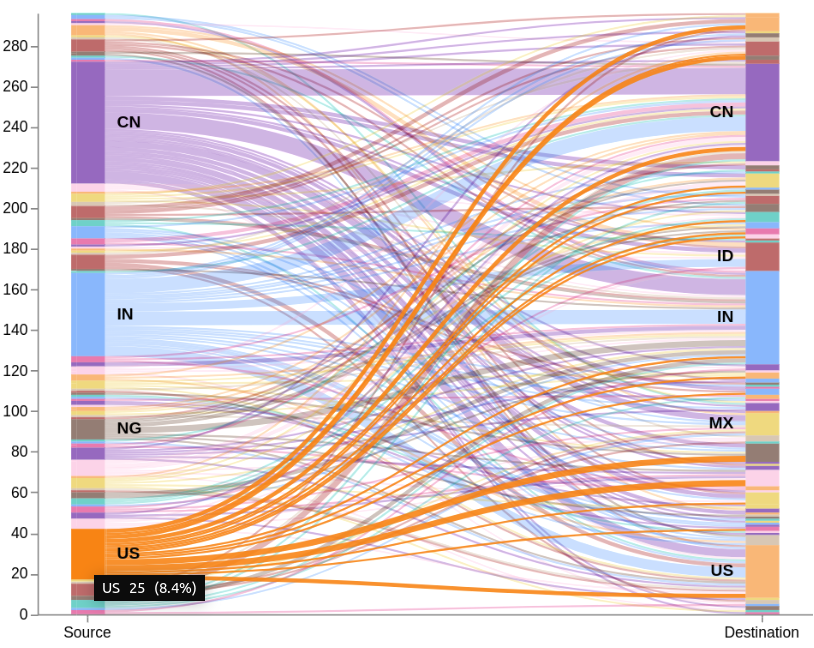
This is an example of how to build an sankey visualization using the vega visualization in Kibana.

Analyze live network topology, packet inspection signals, application flows, DNS/TLS posture, and Suricata findings with reusable Kibana dashboards and Vega visualizations.
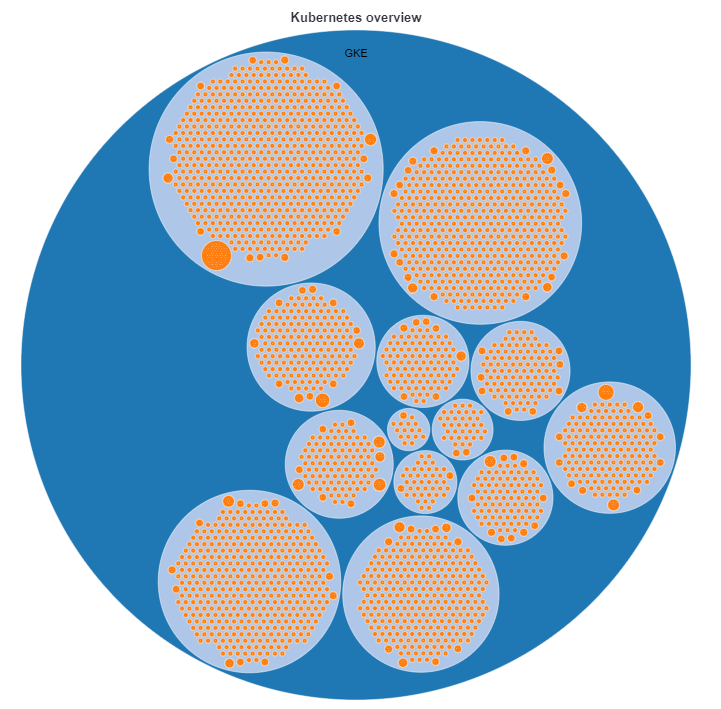
Vega visualization to show the dependencies between the different Kubernetes components in a single visualization

A vega visualization that shows the connection between resource group, resource type and the resource itself based on Elastic agent azure billing data integration.
Page
Find free Kibana dashboards, Elastic Security content, Watcher rules, Logstash pipelines, Vega visualizations, and reusable Elastic Stack examples.
Search results are evaluated by ElasticPress using Elasticsearch clusters from Elastic Cloud.