
Filebeat Suricata Canvas dashboard
A Kibana Canvas dashboard example that visualizes suricata logs collected with Filebeat.

Get content for Kibana, Elasticsearch, Logstash and more
Elastic Content Share
Download overview
Elastic Solutions are a great addition to the common usage of Elasticsearch, Kibana, Logstash and Beats. They combine the power of all tools and provide best practice implementation for their specific key area.
However using Elastic Solutions in Kibana also feels limited from time to time as you need to stick to the UI of the specific solution. If you want to get more out of the data you need to create your own dashboard based on Elastic Common Schema (ECS) to reuse the data that is also used in the Elastic Solutions.
Here you find community driven dashboards and other conent that enhancing the OOTB experience of any Elastic solution.
Use this collection
Solutions downloads collect reusable Elastic Stack examples that can help you build dashboards, rules, pipelines, visualizations, and operational workflows faster.
Download the content, import it into your Elastic environment, review the saved objects or rules, and adapt the fields, filters, and visualizations to your own data.
Use the related collections below to move between dashboards, security content, observability examples, pipelines, Elasticsearch resources, and AI-assisted Elastic workflows.
A Kibana Canvas dashboard example that visualizes suricata logs collected with Filebeat.

This is a simple canvas dashboard example that analyzes logs created by Filebeat.

A collection of rules based on the Sigma detection rules for web server looks, e.g. apache, nginx or IIS.
A collection of rules based on the Sigma detection rules for proxy server and web server looks, e.g. zeek or suricata.
A collection of rules based on the Sigma detection rules for Windows Sysmon events based on Winlogbeat data.
A collection of rules based on the Sigma rules for Windows (process creation folder) based on Winlogbeat data .
A collection of rules based on the Sigma rules for Windows (inbuilt folder) based on Winlogbeat data .
A collection of rules based on the Sigma rules for AWS based on the Filebeat AWS module and Elastic agent integration.
A collection of rules based on the Sigma rules for Zeek based on the Filebeat Zeek module.
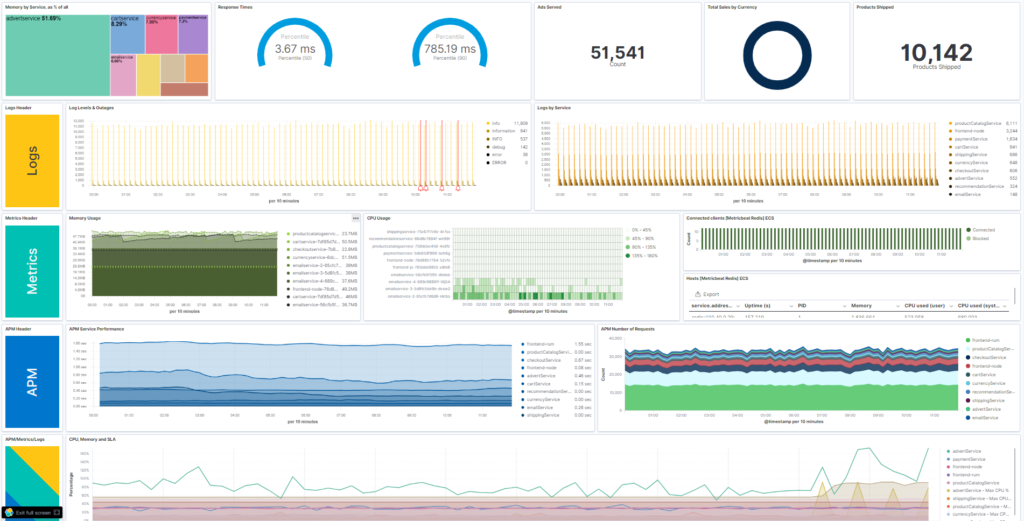
A single pane of glass dashboard for Logs, Metrics, APM data and business KPIs.
Search is the foundation of all kinds of experiences—from finding documents to monitoring infrastructure to preventing security threats. Elastic is a search company that supports three solutions built on a powerful stack: Elastic Stack. Deploy them anywhere (from cloud to bare metal) to instantly find actionable insights from any type of data.
Elastic Security equips security teams to stop threats quickly and at cloud scale, with the best-in-class platform for prevention, detection, and response.
Its the first free and open XDR solution and its one of the leading SIEM technologies that you can find. One of the great things about Elastic Security is the combination of free Elastic Endpoint Security and the free Elastic SIEM in one single solution. That makes it really handy to start with your Security project and improve it over time to perfectly fit into your needs.
Bring your logs, metrics, and APM traces together at scale in a single stack so you can monitor and react to events happening anywhere in your environment. And it’s free and open.
With Elastic Observability you get everything you need to monitor your full IT Landscape. It starts with the Infrastructure monitoring, including network monitoring but also fulfils the needs for complete Application level monitoring using the APM technology. Going with Elastic Observability provides the ability to extend your current monitoring landscape with every single bit that is missing. And at the same time you also have the ability to replace more expensive tools with this free solution.