Description
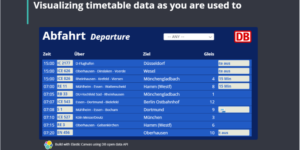
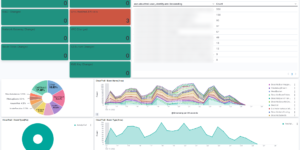
This is a Kibana canvas example to visualize data flows. While this is very important to get an high level overview of whats working in your environment its quite hard to build visualizations like this. The data flows can be used very flexible for every kind of network topology. Use the Kibana canvas expression language to activate or deactivate the data or network flows based on your data. This Kibana dashboard can be used for network monitoring as well as application monitoring. Configure it the way you need.
The different slides containing examples build with animated pictures and also examples using CSS.
The data flow visualization are a great addition to your network monitoring use case using the Elastic stack. Monitoring network traffic is essential for obtaining observability and protecting the environment-ensuring a high level of performance and security. With Packetbeat as a lightweight network packet analyzer you can send data from hosts and containers to Logstash or Elasticsearch. Using that data in this Kibana dashboard is really a great fit if you would like to visualize the network data in an easy to consume fashion.
Monitor your network and applications
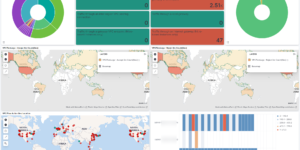
Network protocols like HTTP enable you to keep up to date with application delays and errors, response time, SLA performance, user access patterns and trends, etc. The Elastic Stack using packetbeat gives you access to this data to understand how traffic flows through the network. It is completely passive, has zero latency overhead, and does not interfere with your infrastructure.
Network monitoring
Its very important to observe and protect network segments. Nowadays, it is absolutely necessary to monitor your network and equipment, and every organization should collect all possible security information about its equipment and network. If you do not monitor the network or devices, how can you detect normal behavior vs. attacks? Although there are obvious malicious attacks, early detection is crucial in any network security incident. Network monitoring is one of the best and more practical ways to detect abnormal activity.
| Tested versions | 7.1, 7.10 |
| ECS compliant |
Reviews
The animations are great to build my own canvas visualizing network flow events. Thanks for sharing!
206 of 398 people found this review helpful.
Help other customers find the most helpful reviews
Did you find this review helpful?
It states error in kibana
Couldn’t upload ‘export.ndjson’
Only JSON files are accepted
If we copy its content and create another file of .json extension then it displays error like
Couldn’t upload ‘test.json’
JSON.parse: unexpected non-whitespace character after JSON data at line 2 column 1 of the JSON data
200 of 394 people found this review helpful.
Help other customers find the most helpful reviews
Did you find this review helpful?
-

Follow the download guide pls. The canvas files need to get imported via the saved object management in Kibana. The upload into canvas directly does not work.
Thank you for your feedback.
209 of 404 people found this review helpful.
You must log in to submit a review.