
Postfix Mail Server Dashboard
Monitor Postfix mail server logs with Kibana.

Get content for Kibana, Elasticsearch, Logstash and more
Elastic Content Share
Browse Elastic Stack content tested with version 8.19.20.
Use this collection
8.19.20 downloads collect reusable Elastic Stack examples that can help you build dashboards, rules, pipelines, visualizations, and operational workflows faster.
Download the content, import it into your Elastic environment, review the saved objects or rules, and adapt the fields, filters, and visualizations to your own data.
Use the related collections below to move between dashboards, security content, observability examples, pipelines, Elasticsearch resources, and AI-assisted Elastic workflows.
Monitor Postfix mail server logs with Kibana.

Analyze Squid Proxy access logs ingested via Filebeat.

Monitor Spring Boot applications using Micrometer metrics.

Visualize your Microsoft 365 data in Kibana.

Download the Elasticsearch Performance Troubleshooting Kit to efficiently diagnose and resolve slow query issues in your Elasticsearch environment.

Elastic Resource Optimization Dashboard to seamlessly integrate APM insights with cloud cost data for actionable resource management and cost-saving strategies

Pulls Elastic Cloud Billing information from the Billing API then sends it to an Elasticsearch cluster and visualizes the results in Kibana dashboards.
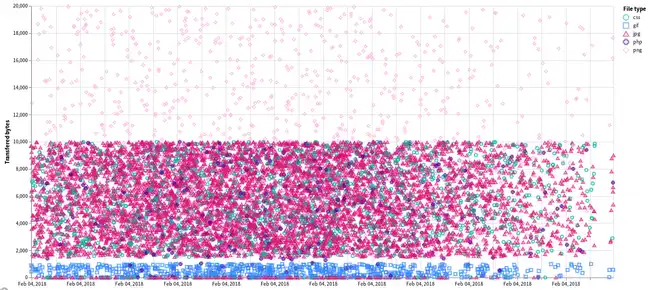
A scatterplot visualization made with Vega Lite for Kibana

A Kibana dashboard that visualizes the result of the crawler from Elastic Enterprise Search

Cloudflare dashboards and ingest pipelines to visualize cloudflare logs