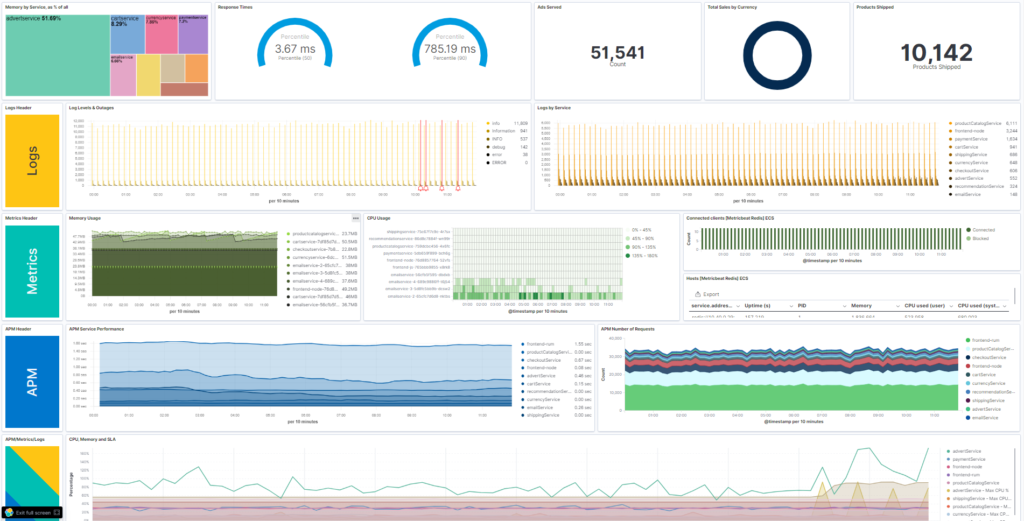
Kibana is a very powerful tool to built and work with dashboards of any kind. The power to bring information from various different data sources together is invaluable. It is an open-source tool that allows you to build data visualization dashboards. You can put whatever kind of data you want onto these dashboards. And of course you can customize dashboards based on your needs. In this article we show you how to import Kibana dashboards intro your ELK deployment.

There are many kind of ELK dashboards that you can import and use immediatly after you’ve setup your ELK Stack for the first time. And there are also a lot dashboards that come out of the box in the Kibana solutions. You can find any kind of observability dashboard, like dashboards for log analysis, dashboards for metric analysis and dashboards to visualize your APM traces and other application related data. In Elastic security you can use dashboards that summarize your host and network related data. Nevertheless it can be very useful to import additional Kibana SIEM dashboards to extend the way you are interacting with the data.
Import Metricbeat and Filebeat dashboards
Metricbeat and Filebeat are very usefull lightwight data shippers that collecting data from many different data sources. These different data sources are organized as so called modules. Each module is delivering its own visualizations and dashboard to quickly getting insight into the data they are collecting using Kibana.
Setup Metricbeat dashboards
To import Metricbeat dashboards into Kibana you just need to download Metricbeat and run the setup command. You will get dashboards for Kubernetes, MySQL, Apache and other technologies.
Follow this documentation to import Metricbeat dashboards in Kibana
Setup Filebeat dashboards
To import Filebeat dashboards into Kibana you just need to download Filebeat and run the setup command. You will get dashboards to visualize information gathered from logs from e.g. Kafka, nginx and many more.
Follow this documentation to import Filebeat dashboards in Kibana
Import community dashboard examples in Kibana
The Elastic Stack (aka as ELK Stack) has a very vibrant community. Thousand of people using Kibana, Elasticsearch, Logstash and Beats every day. While using it they are also creating stunning dashboards to fulfil their specific needs. However these customer specific dashboards are often also very useful for other community members. To share these dashboards the elastic content share is offering the possiblity to upload dashboards into our Kibana dashboard gallery. In the Kibana dashboard gallery you can find ELK dashboards and Kibana Canvas examples that are made by the community and get imported into your ELK deployment.
Every Kibana dashboard example that we are offering has import instructions attached. Most of the dashboards can get installed automatically if you choose deployment to Elastic Cloud. The only thing you need to do in this case is to create a temporary API key and enter it into the form. The import itself will be done by the elastic content share for you. For manual installation it’s very easy to summarize the steps to import Kibana dashboards into the following:
- Choose your favourite ELK dashboard in our dashboard gallery and click on download now (its free)
- Download the zip file and unzip it. You should find an export.ndjson file into the archive.
- In your Kibana deployment, navigate to Stack management -> Saved objects
- Click on import and select the .ndjson file to import your dashboard into Kibana
- Navigate to the dashboard app within Kibana and use or customize your brand new dashboard
Interested in testing it? Browse our Kibana example gallery to find dashboards that you can import now.
