
Watcher Download overview
Watcher downloads
Watcher job to integrate ChatGPT in Elasticsearch
Watcher job to integrate ChatGPT API from OpenAI in Elasticsearch. Helpful to find solutions for error messages very quick.
Move to next ILM phase Watcher
This watcher job is moving specific indices based on e.g. disc usage into the next ILM phase.

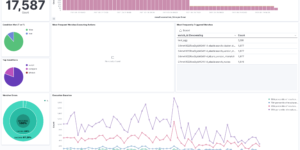
Kibana alerting enhancement
This bundle enhances the Kibana alerting experience. Storing all relevant information in indices and visualize the data in dashboards.
Watch to move older Elasticsearch indices into freezed state
This watch is moving time based indices into the frozen state.
Watch to detect large shards
This watch is getting data from the Elasticsearch shards API directly and checking for large shards.
Watch for changes in IOWaits
A watch which alerts if the time spent by a hosts CPU in IOWait, has increased by more than than N% in the last Y mins.
Uptime watch using Heartbeat data
This watch checks the availability of your Heartbeat observed services. It will trigger an alert whenever at least one of your services is down.
More about Watcher
Watcher is a great alerting and automization tool within the Elastic Stack (aka ELK stack). Its used for many different alerting tasks during the past years. Recently Elastic has introduced Kibana Alerting and Actions. This is a simpler but also less powerful way for building alerts. On the other hands Kibana alerts also solving challenges that were hard to build with watcher like the introduction of a state per alert.
In this section you can download prebuilt watcher alerting jobs for your Elasticsearch deployment.
Using Watcher jobs you can monitor changes or anomalies in the data and perform necessary actions in response. For example, you might want to: Monitoring social media is another way to detect failures in user-oriented automated systems such as ATMs or ticketing systems. When the number of tweets and posts in a certain area exceeds the important threshold, please notify the service technician. Monitor your infrastructure and track disk usage over a period of time. If the available space on any server may be exhausted in the next few days, please open a help desk ticket. Track network activities to detect malicious activities, and actively change the firewall configuration to reject malicious users. Monitor Elasticsearch and send a notification to the system administrator immediately if the node leaves the cluster or the query throughput exceeds the expected range. Track the application response time. If the page load time exceeds the SLA for more than 5 minutes, please open the service desk notice. If the one-hour SLA is exceeded, please notify the duty administrator.