
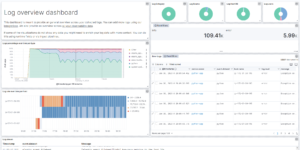
Kibana Download overview
Kibana downloads
Elasticsearch Performance Troubleshooting Kit
Download the Elasticsearch Performance Troubleshooting Kit to efficiently diagnose and resolve slow query issues in your Elasticsearch environment.
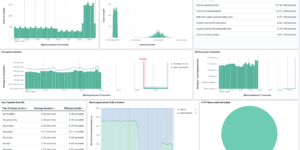
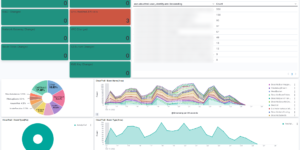
Resource Optimization Dashboard
Elastic Resource Optimization Dashboard to seamlessly integrate APM insights with cloud cost data for actionable resource management and cost-saving strategies
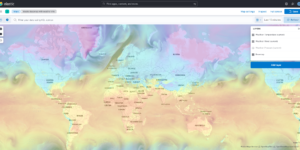
Kibana Maps with Open Weather Map
This is the default basemap of Kibana incl. the Open Weather Map tile for temperature, wind and pressure

Terraform Elasticsearch environments
Terraform example scripts to deploy Elastic Cloud Clusters + all necessary components in AWS and GCP
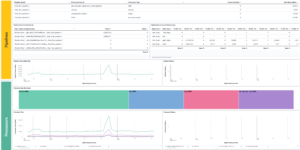
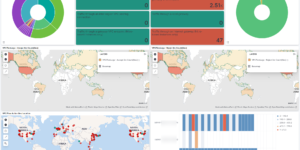
AWS Cloudtrail Monitoring dashboard
Deep insights into AWS Cloudtrail events for SIEM and Monitoring
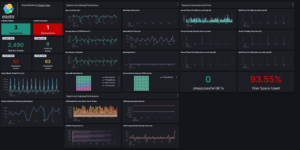
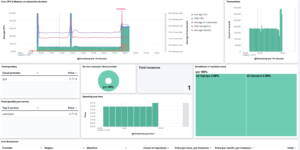
Elastic Stack Monitoring Dashboard
Kibana dashboards that is showing the monitoring data collected by Elastics in built monitoring capabilities.
More about Kibana
Download additional Kibana content and use it immediately within your Elastic deployment. Kibana content can be dashboards, canvas boards and any kind of visualization like pre build vega visualizations.
Kibana is a great tool to visualize any kind of data that is stored within Elasticsearch. Elastic delivers huge set of Kibana content within the Kibana apps. But users usually want to customize their dashboards and other views. Using Kibana this is possible for every kind of visualization.