
Solutions Download overview
Elastic Solutions are a great addition to the common usage of Elasticsearch, Kibana, Logstash and Beats. They combine the power of all tools and provide best practice implementation for their specific key area. However using Elastic Solutions in Kibana also feels limited from time to time as you need to stick to the UI of the specific solution. If you want to get more out of the data you need to create your own dashboard based on Elastic Common Schema (ECS) to reuse the data that is also used in the Elastic Solutions. Here you find community driven dashboards and other conent that enhancing the OOTB experience of any Elastic solution.
Solutions downloads
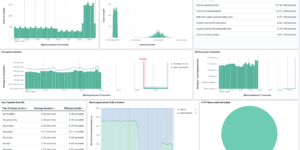
Elasticsearch Performance Troubleshooting Kit

Download the Elasticsearch Performance Troubleshooting Kit to efficiently diagnose and resolve slow query issues in your Elasticsearch environment.
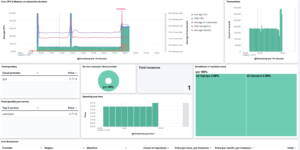
Resource Optimization Dashboard
Elastic Resource Optimization Dashboard to seamlessly integrate APM insights with cloud cost data for actionable resource management and cost-saving strategies

Watcher job to integrate ChatGPT in Elasticsearch

Watcher job to integrate ChatGPT API from OpenAI in Elasticsearch. Helpful to find solutions for error messages very quick.

Impossible travel transform job
Impossible travel detection by calculating the distance between two login locations in combination with the time between the two logins

Terraform Elasticsearch environments
Terraform example scripts to deploy Elastic Cloud Clusters + all necessary components in AWS and GCP
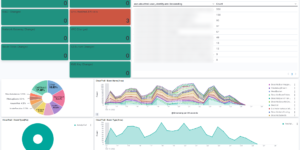
AWS Cloudtrail Monitoring dashboard
Deep insights into AWS Cloudtrail events for SIEM and Monitoring

Kubernetes architecture overview
Vega visualization to show the dependencies between the different Kubernetes components in a single visualization
More about Solutions
Search is the foundation of all kinds of experiences—from finding documents to monitoring infrastructure to preventing security threats. Elastic is a search company that supports three solutions built on a powerful stack: Elastic Stack. Deploy them anywhere (from cloud to bare metal) to instantly find actionable insights from any type of data.
What is Elastic Security?
Elastic Security equips security teams to stop threats quickly and at cloud scale, with the best-in-class platform for prevention, detection, and response.
Its the first free and open XDR solution and its one of the leading SIEM technologies that you can find. One of the great things about Elastic Security is the combination of free Elastic Endpoint Security and the free Elastic SIEM in one single solution. That makes it really handy to start with your Security project and improve it over time to perfectly fit into your needs.
What is Elastic Observability?
Bring your logs, metrics, and APM traces together at scale in a single stack so you can monitor and react to events happening anywhere in your environment. And it’s free and open.
With Elastic Observability you get everything you need to monitor your full IT Landscape. It starts with the Infrastructure monitoring, including network monitoring but also fulfils the needs for complete Application level monitoring using the APM technology. Going with Elastic Observability provides the ability to extend your current monitoring landscape with every single bit that is missing. And at the same time you also have the ability to replace more expensive tools with this free solution.