
Canvas Download overview
Kibana Canvas is a data visualization and presentation tool that allows you to get real-time data from Elasticsearch, and then combine the data with colors, images, text and your imagination to create dynamic, multi-page, pixel-perfect monitor. If you are a bit creative, technical and curious, then Canvas is your ideal choice. The following section shows all Kibana Canvas examples that are already offered by our content creators. Do you also have great Kibana Canvas workpads? Upload it for the community. Its easy and free!
Canvas downloads
Google Cloud Log Ingestion dashboard
Canvas Board to analyze the log data collection of Google Cloud via Dataflow using the Google Cloud Metric module data

Filebeat Suricata Canvas dashboard
A Kibana Canvas dashboard example that visualizes suricata logs collected with Filebeat.

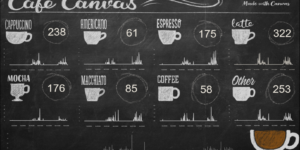
Filebeat Log analysis canvas example
This is a simple canvas dashboard example that analyzes logs created by Filebeat.

Office display canvas example
Kibana canvas example showing an office screen with weather, news and stock information
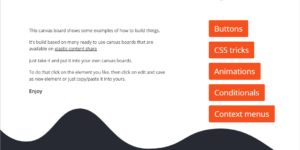
Kibana Canvas examples collection
A collection of canvas examples, like using conditionals, creating buttons, animations or context menues. Just copy paste into your Kibana Canvas project.

Detection engine alerts overview dashboard
Kibana Canvas dashboard that shows an aggregated view on the results of the detection engine in Elastic Security.

Data flow canvas
This canvas examples shows some possibilities of how to visualize data flows. Every flow can be activated / deactivated based on your Elasticsearch data.
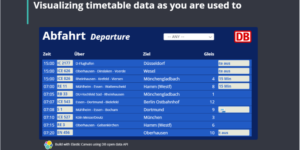
Timetable canvas
This canvas examples shows timetable data from trains. Its build based on the real world information panel in german trian stations. Its refreshing based on current time.
More about Canvas
Kibana Canvas is a data visualization and presentation tool that is part of the Elastic Stack. It allows users to create dynamic, interactive presentations and dashboards that can be used to explore, analyze, and visualize data.
Kibana Canvas is built on top of the Kibana platform, and shares many of its features and capabilities. However, Kibana Canvas adds additional functionality that allows users to create rich, multimedia presentations that combine data visualizations, text, images, and other elements.
Some key features of Kibana Canvas include:
- A drag-and-drop interface that makes it easy to create and customize presentations.
- The ability to combine data visualizations, text, images, and other elements to create dynamic, interactive presentations.
- The ability to link presentations to live data sources, allowing them to be updated in real-time.
- The ability to share presentations with others and collaborate on their creation and customization.
In conclusion, Kibana Canvas is a powerful tool for creating dynamic, interactive presentations and dashboards that can be used to explore, analyze, and visualize data. It is a popular choice for organizations that need to present data in an engaging and interactive way.
Nevertheless it is also really hard to master Kibana Canvas and get the full power out of it. Our Kibana Canvas examples helping you to get started. We have Canvas examples that run immediately after deploying it. Other Canvas examples just show you the art of whats possible.
The above text was partly created with help of https://chat.openai.com/chat