
Kibana Dashboards Download overview
Kibana completes the data visualization of the ELK stack. This tool is used to visualize Elasticsearch documents and help developers quickly understand it. The Kibana dashboard provides a variety of interactive charts, geospatial data, and graphs to visualize complex queries. It can be used to search, view, and interact with data stored in the Elasticsearch directory. Kibana can help you perform advanced data analysis and visualize your data in various tables, charts, and maps. In Kibana, there are multiple ways to perform searches on your data. The following section shows a collection of Kibana objects like Kibana dashboards, visualizations and more.
Kibana Dashboards examples
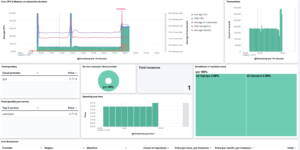
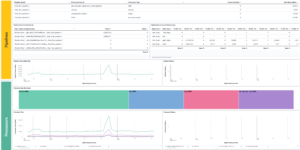
Resource Optimization Dashboard
Elastic Resource Optimization Dashboard to seamlessly integrate APM insights with cloud cost data for actionable resource management and cost-saving strategies
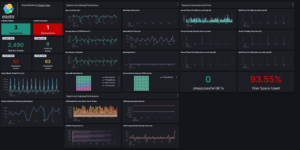
Elastic Stack Monitoring Dashboard
Kibana dashboards that is showing the monitoring data collected by Elastics in built monitoring capabilities.

Kubernetes architecture overview
Vega visualization to show the dependencies between the different Kubernetes components in a single visualization

CMDB dependency in Kibana Dashboard
Kibana vega example to show how to load visualize relationships between different infrastructure and network components in vega.

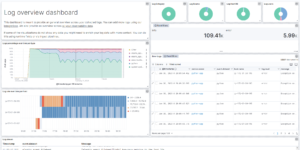
Google Cloud monitoring dashboard
Dashboard to monitor GCP resources using different metrics and logs.
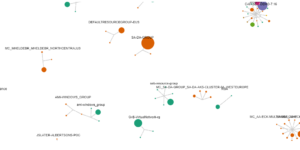
Azure billing data network
A vega visualization that shows the connection between resource group, resource type and the resource itself based on Elastic agent azure billing data integration.

Elastic Cloud Billing data collection and Kibana dashboard
Pulls Elastic Cloud Billing information from the Billing API then sends it to an Elasticsearch cluster and visualizes the results in Kibana dashboards.
More about Kibana Dashboards
With Kibana dashboards you can fulfill many different use cases like
- Powerful front-end dashboarding which is capable of visualizing indexed information from the elastic cluster
- Enables real-time search of indexed information and up to peta byte scale
- You can search, view, and interact with data stored in Elasticsearch
- Execute queries on data & visualize results in charts, tables, and maps
- Configurable dashboard to slice and dice logstash logs in elasticsearch
- Capable of providing historical data in the form of graphs, charts, etc.
- Real-time dashboards which is easily configurable
- Kibana ElasticSearch enables real-time search of indexed information
Using e.g. Kibana Canvas dashboards makes it easy to visualize any kind of information in seconds.