
Dashboards Download overview
This is our collection of prebuilt Kibana Dashboards. Kibana is a great tool to visualize data stored in Elasticsearch. Kibana can act as the user interface for monitoring, SIEM and general data analytics. It includes a lot of OOTB visualizations and apps. Our Kibana Dashboards collection is an extension to the default visualizations. Using them dramatically helps to customize Kibana for your needs. Therefore its always a great idea to use them.
Dashboards downloads
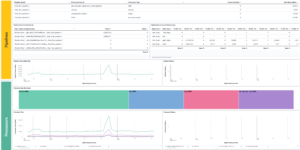
Elasticsearch Performance Troubleshooting Kit
Download the Elasticsearch Performance Troubleshooting Kit to efficiently diagnose and resolve slow query issues in your Elasticsearch environment.
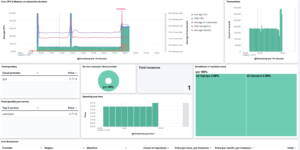
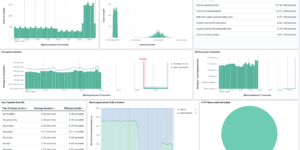
Resource Optimization Dashboard
Elastic Resource Optimization Dashboard to seamlessly integrate APM insights with cloud cost data for actionable resource management and cost-saving strategies
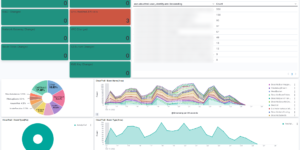
AWS Cloudtrail Monitoring dashboard
Deep insights into AWS Cloudtrail events for SIEM and Monitoring
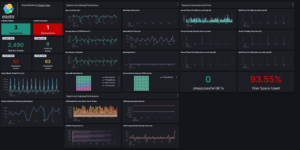
Elastic Stack Monitoring Dashboard
Kibana dashboards that is showing the monitoring data collected by Elastics in built monitoring capabilities.

Kubernetes architecture overview
Vega visualization to show the dependencies between the different Kubernetes components in a single visualization

CMDB dependency in Kibana Dashboard
Kibana vega example to show how to load visualize relationships between different infrastructure and network components in vega.
More about Dashboards
Kibana can be used for:
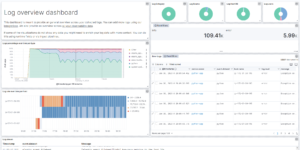
- Logging and log analytics
- Infrastructure metrics and container monitoring
- Application performance monitoring (APM)
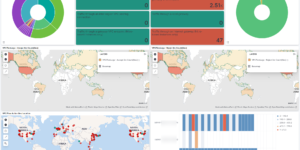
- Geospatial data analysis and visualization
- Security analytics / SIEM
- Business analytics
A Kibana dashboard is a collection of charts, graphs, metrics, searches, and maps that have been collected together onto a single pane. Dashboards provide at-a-glance insights into data from multiple perspectives and enable users to drill down into the details.