
Dashboard Download overview
Kibana dashboards are a powerful tool for exploring, analyzing, and visualizing data. They are part of the Elastic Stack, and are used by organizations around the world to gain insights from their data and make better-informed decisions. Kibana dashboards are highly customizable and can be used to visualize data from a wide variety of sources. They are built using a drag-and-drop interface, which makes it easy for users to create complex visualizations without the need for coding. Some common examples of Kibana dashboards include: A log analysis dashboard that shows the number of log events over time, the most common log levels, and the top error messages. An application performance dashboard that shows the response times and error rates of different components of an application, as well as the top slowest and most frequently-used pages. A network monitoring dashboard that shows the throughput, latency, and error rates of different network devices, as well as the top traffic sources and destinations.
Dashboard examples
Elasticsearch Performance Troubleshooting Kit
Download the Elasticsearch Performance Troubleshooting Kit to efficiently diagnose and resolve slow query issues in your Elasticsearch environment.
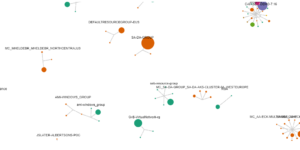
Azure billing data network
A vega visualization that shows the connection between resource group, resource type and the resource itself based on Elastic agent azure billing data integration.

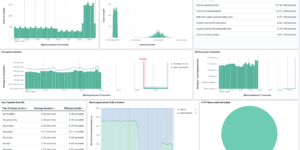
Elastic Cloud Billing data collection and Kibana dashboard
Pulls Elastic Cloud Billing information from the Billing API then sends it to an Elasticsearch cluster and visualizes the results in Kibana dashboards.

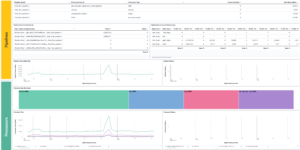
Office 365 dashboards
A collection of Kibana dashboards to provide a holistic view of Microsoft Office 365 environments
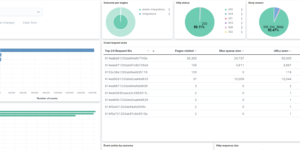
Crawler dashboard
A Kibana dashboard that visualizes the result of the crawler from Elastic Enterprise Search
Cloudflare Kibana dashboards
Cloudflare dashboards and ingest pipelines to visualize cloudflare logs
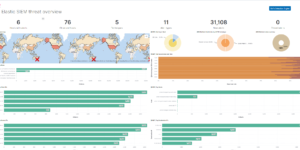
Threat detection Kibana dashboard
Kibana dashboard example visualizing the results of the Elastic SIEM detection engine

Kibana alerting enhancement
This bundle enhances the Kibana alerting experience. Storing all relevant information in indices and visualize the data in dashboards.
More about Dashboard
Kibana gives you the freedom to select the way you give shape to your data. A dashboard within Kibana builds the final stage where all your visualizations live in.
With the drill down capabilties you are able to start at a very high level and dive deep into the data with just a few clicks.
Building an Kibana Dashboard is easy. But making it really great and useful for you use case can take a couple of iterations. Our Kibana Dashboard examples helping you to get an basic understanding about how Dashboards could look like.
In conclusion, Kibana dashboards are a powerful and flexible tool for exploring, analyzing, and visualizing data. They are used by organizations around the world to gain insights from their data and make better-informed decisions. With the help of Kibana plugins, they can be customized and extended to meet the specific needs of any organization.
The text is partly made with help of https://chat.openai.com/chat