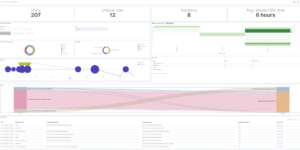
APM Download overview
Elastic APM (Application Performance Monitoring) is a feature of the Elastic Stack that allows you to monitor the performance of your applications in real time. With Elastic APM, you can get insights into the performance of your applications, including response times, errors, and other metrics. This can be useful for identifying performance bottlenecks and other issues that may be affecting the user experience of your applications. Elastic APM is a valuable tool for anyone looking to improve the performance of their applications and ensure that they are running smoothly.
APM examples
More about APM
Already housing logs and system metrics in Elasticsearch? Expand to application metrics with free and open Elastic APM. See exactly where your application is spending time so you can quickly fix issues and feel good about the code you push.
The following downloads extending the Elastic APM out of the box Kibana dashboards.
You just received an alert about an unusually high error rate. What’s next? Open up the services overview page for a summary of a service’s transactions, dependencies, and critical metrics so you can understand the scope of issues in real time. Once you’re ready to dig deeper, our dedicated UI uses the power of search to help you identify bottlenecks and zero in on problematic changes at the code level.
The text was partly created with https://chat.openai.com/chat


