
The Elastic Stack enables users to do many different use cases. Users can enhance their search features, their visibility into the application as well as the security of the application and the company behind it. One very popular use case is real user monitoring. With Elastic Real User Monitoring you collect all the necessary information and in Kibana you also got the possibility to analyze this data and get value out of it.
The Elastic Content Share already provides a couple of dashboards that extending the OOTB real user monitoring capabilities of the Elastic Stack, like the following:
Watcher job to integrate ChatGPT in Elasticsearch
Watcher job to integrate ChatGPT API from OpenAI in Elasticsearch. Helpful to find solutions for error messages very quick.

Observability Kibana Dashboard
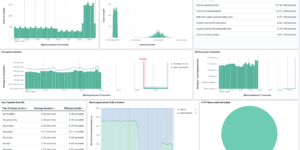
A single pane of glass dashboard for Logs, Metrics, APM data and business KPIs.
Elasticsearch Performance Troubleshooting Kit
Download the Elasticsearch Performance Troubleshooting Kit to efficiently diagnose and resolve slow query issues in your Elasticsearch environment.
What is Elastic APM?
Elastic APM is an application performance monitoring system built on the Elastic Stack. It allows you to monitor software services and applications in real time, by collecting detailed performance information on response time for incoming requests, database queries, calls to caches, external HTTP requests, and more.
What is Elastic Real User Monitoring?
Elastic real user monitoring captures user interactions with the web browser and provides a detailed view of the “real user experience” of your web applications from a performance and user experience perspective. Elastic’s RUM Agent is a JavaScript Agent, which means it supports any JavaScript-based application. RUM can provide valuable insight into your applications. You wanna know how much time users spending on your page and what they are actually doing within your web application? RUM is the right way to do that. This are a few example use cases that you can do collecting Real User Monitoring data:
- RUM performance data can help you identify bottlenecks and discover how site performance issues affect your visitors’ experience
- User agent information captured by RUM enables you to identify the browsers, devices, and platforms most used by your customers so that you can make informed optimizations to your application
- Together with location information, individual user performance data from RUM helps you understand regional performance of your website worldwide
- RUM provides insight and measurement for your application’s service level agreements (SLA)
- RUM data can be used to determine how often a specific page was used by one user
- RUM data also includes information about the referrer that has let the user to your application and therefore also be used to track the success of your SEO efforts
How to calculate the conversion rate just using the data collected by Elastic APM
The conversion rate shows how many users of an web application do what the expect them to do. Lets say you have a web shop. In a web shop you would like to know how many of users that visiting your page also buying something. Every user is a potential customer so its also important to understand why users do not convert.
To calculate the conversion rate or in other words the success of web applications we need to follow these steps:
- Define what is a user for you. It can be unique IP address visiting the application. But it might be also fine to only track users that are registered already.
- Define what conversion means in your web application. In a web shop the conversion is to sell a product. But it could be also a conversion if the users signs the newsletter or is using the contact me form. Its also possible that all of these options are different kind of conversions.
- Learn how to detect a conversion in the data. In many cases the detection can be done by checking for a specific URL, e.g. /purchase-confirmation .
- Finally visualize the results on a Kibana dashboard or Canvas board using the right visualizations.
1.) Define the user
Your users can be various different things depending on the application you are working on. If you working on an application that allows visitors to register, a user could be the anonymous visitor or the registered account. The definition of the user is important, because this amount of users using your application is the base line for the calculation of the conversion rate.
It can also happen that your definition of a user varies depending on the goal you want to calculate the conversion. In some cases a visitor that is registering at your application can be converted user and sometimes the registered account that is buying something in your e Commerce store could be the converted user.
2.) Define conversion
The second very important step is to define the goal you would like to observe. A goal could be maximize the newsletter abonnements, to minimize to abandonment rate in your e Commerce store, to increase sales in your web shop and many more.
Knowing the target you are working on is crucial. Also knowing how to detect that the goal has been fulfilled or not is the ground work to calculate the conversion rate in real time using the Elastic Stack and its APM components.
3.) Detect conversion within your data
The next step is to collect the data and learn from it. To start collecting real user monitoring data from your application you need to have an Elasticsearch cluster and add a bit of JavaScript into your Web Application.
The easiest way to get an Elasticsearch cluster is to start a 14 day free trial using Elastic Cloud. We want to use the Observability solution that contains Elastic APM and Real user monitoring as well as Log Management, Metric Monitoring and much more.
To start with Real user monitoring all you need to know is in the documentation of Elastic APM.
Now that you have the data in your Elastic deployment you should see the apm* index pattern when clicking on Discover in the Kibana Frontend. If you don’t see it there are two possible reasons for that. You may need to setup the index pattern manually. To do that navigate to Stack Management -> Index Patterns and add a new apm* index pattern. This only works if you already have data collected using the Real user monitoring agent from Elastic.
Having everything in place to start the real user analysis and tracking the success of the application we can now start to define the conversion rate. In Discover you can have a look into the data that is collected by the real user monitoring agent. You will find information about the referring page and also about the page the user was visiting. Every document is one attempt to load something from your server. You get information about the time it takes to load assets and much more.
For now the next step is to find the events that are defining your goal from 2. Lets say your goal is to increase to amount of successful purchases. You may have a page that is triggered ONLY when the purchase was successful. The page could have the following URL: https://<your-domain>/purchase-confirmation . To find all the events that were recorded when a user was loading this page you could filter for:
transaction.type: "page-load" and url.full: *purchase-confirmation*After you’ve found a filter that works for your goal you should save the query (next to the search bar) and also the full discover search (the save button above the search bar). The query you can use to reference in other visualizations and views. You can also reuse the query in one of your dashboards to only show the successful conversions and the customer journey that led to the conversion. The saved discover search you can use to display the results of this search next to other data on one single Kibana dashboard.
4.) Bringing all information together in one dashboard
First thing we do is opening the Dashboard section in Kibana. If you already have Kibana dashboards you may need to click on Create dashboard.
By clicking on Create visualization a new Lens editor gets started. You can calculate the conversion rate very easily within Lens using Formulas (available >=v7.14). First you need to choose Metric as visualization type. In the right sidebar you can switch to use a Formula. Lens Formulas are pretty useful to do any kind of calculation on top of your data. Especially if you need to compare two different search results. In our case the calculation is really trivial. We calculate the amount unique IPs (our definition of a user) first for all page-loads as well as the amount of unique IPs that reached the goal of the conversion (see step 2).
In Lens Formula this looks like this:
unique_count(client.ip, kql='url.full : *purchase-confirmation*')/unique_count(client.ip)If you have a similar conversion use case I would recommend to add transaction.type: “page-load” as general filter of the visualization. This makes the calculation more precise and more performant.
If you are using Elastic <v7.14 you can calculate the conversion rate also using the TimeSeries Visual Builder (TSVB) visualization or build it using the Vega editor. In TSVB you can choose filter ratio as Metric for your visualization. For the simple calculation of an conversion rate this works fine. But if it gets more complex our Lens Formula example is the better choice.
Good content about the free Elastic APM solution