
Logstash Meraki Pipeline
Logstash Pipeline to load Meraki logs via Syslog into Elasticsearch

Get content for Kibana, Elasticsearch, Logstash and more
Elastic Content Share
Download overview
Elastic Security content helps SOC analysts, detection engineers, and security teams move faster with Kibana SIEM dashboards, detection examples, Sigma-related content, investigation workflows, and reusable alerting ideas.
Use this category when you want to extend Elastic Security, compare detection approaches, build a dashboard for threat hunting, or learn how another team structured security monitoring. Review each download before production use, especially rule logic, index patterns, field names, and MITRE ATT&CK mapping.
Detection rules and dashboards follow different import paths. Dashboards usually use Kibana Saved Objects. Detection rules may use Elastic Security rule import workflows or API-based deployment. Always check the download description and the official Elastic Security rules documentation.
Related resources include AI agents for alert triage, AI workflows, SIEM detection rules, and ES|QL examples for hunting and investigation.
Security teams should treat every shared rule or dashboard as a starting point for review. Validate severity, risk score, noise level, required fields, and response steps against your own environment. If the content includes Sigma ideas or threat-hunting logic, map it to the telemetry you actually collect before enabling alerts for production analysts.
For best results, pair security downloads with clear runbooks. A dashboard or rule is more useful when analysts know what to inspect next, which fields matter, and when an alert should become a case.
Use this collection
Elastic Security resources support security monitoring, detection engineering, alert triage, and investigation workflows for teams using Elastic Security and the Elastic Stack.
Download the content, import it into your Elastic environment, review the saved objects or rules, and adapt the fields, filters, and visualizations to your own data.
Use the related collections below to move between dashboards, security content, observability examples, pipelines, Elasticsearch resources, and AI-assisted Elastic workflows.
Logstash Pipeline to load Meraki logs via Syslog into Elasticsearch
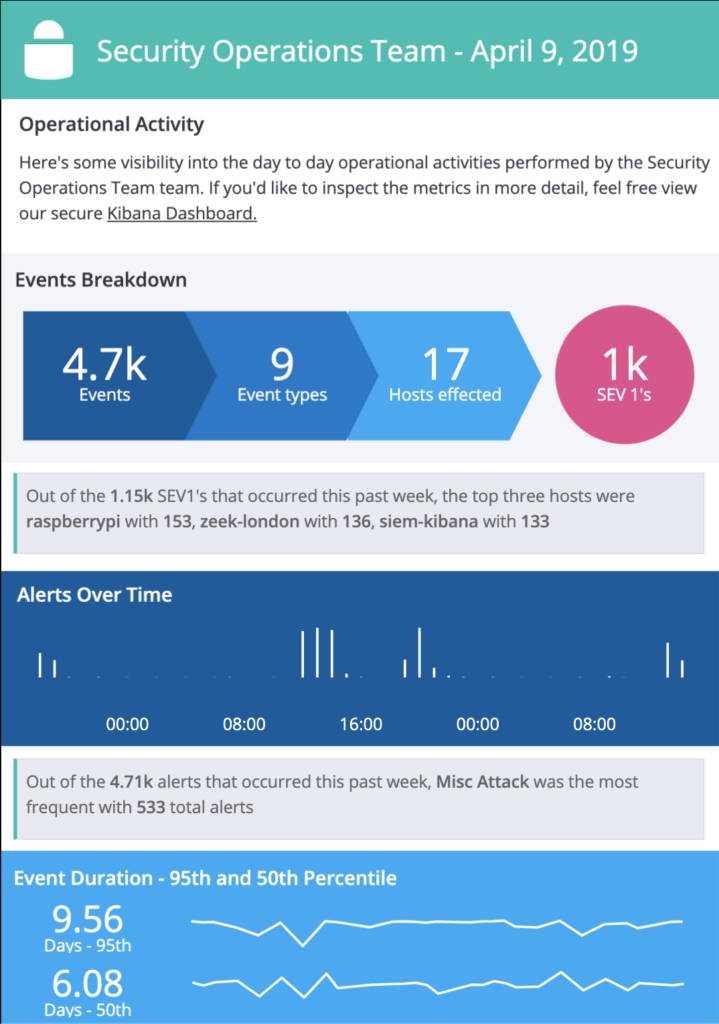
A Kibana Canvas dashboard example that visualizes suricata logs collected with Filebeat.

A collection of rules based on the Sigma detection rules for web server looks, e.g. apache, nginx or IIS.
A collection of rules based on the Sigma detection rules for proxy server and web server looks, e.g. zeek or suricata.
A collection of rules based on the Sigma detection rules for Windows Sysmon events based on Winlogbeat data.
A collection of rules based on the Sigma rules for Windows (process creation folder) based on Winlogbeat data .
A collection of rules based on the Sigma rules for Windows (inbuilt folder) based on Winlogbeat data .
A collection of rules based on the Sigma rules for AWS based on the Filebeat AWS module and Elastic agent integration.
A collection of rules based on the Sigma rules for Zeek based on the Filebeat Zeek module.

Kibana Canvas dashboard that shows an aggregated view on the results of the detection engine in Elastic Security.