
Elastic Observability Download overview
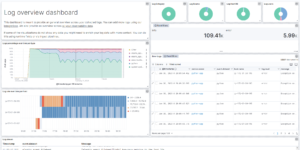
Observability is a quality indicator for a application, similar as convenience, high accessibility, and security. The objective of planning and building an observable framework is to ensure that it is run all the time. Administrators can recognize unfortunate practices (for example administration personal time, mistakes, slow reactions) and have significant data to nail down underlying driver in a successful way (for example point by point occasion logs, granular asset utilization data, and application follows). Normal difficulties keeping associations from accomplishing this apparently clear objectives incorporate not gathering sufficient data, gathering an excessive amount of data, however not making it significant, and dividing admittance to this data. Elastic Observability helps find issues within your IT systems and application as early as possible. After finding that there are issues users can identify the root cause. The following list of downloads extending the out of the box Kibana dashboards.
Elastic Observability downloads
Elasticsearch Performance Troubleshooting Kit
Download the Elasticsearch Performance Troubleshooting Kit to efficiently diagnose and resolve slow query issues in your Elasticsearch environment.
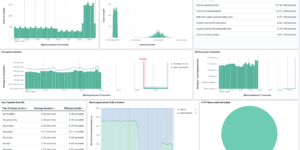
Resource Optimization Dashboard
Elastic Resource Optimization Dashboard to seamlessly integrate APM insights with cloud cost data for actionable resource management and cost-saving strategies
Watcher job to integrate ChatGPT in Elasticsearch
Watcher job to integrate ChatGPT API from OpenAI in Elasticsearch. Helpful to find solutions for error messages very quick.

Terraform Elasticsearch environments
Terraform example scripts to deploy Elastic Cloud Clusters + all necessary components in AWS and GCP

Kubernetes architecture overview
Vega visualization to show the dependencies between the different Kubernetes components in a single visualization

CMDB dependency in Kibana Dashboard
Kibana vega example to show how to load visualize relationships between different infrastructure and network components in vega.

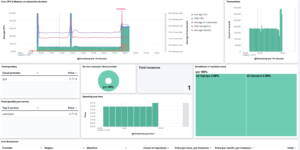
Google Cloud monitoring dashboard
Dashboard to monitor GCP resources using different metrics and logs.

Elastic Cloud Billing data collection and Kibana dashboard
Pulls Elastic Cloud Billing information from the Billing API then sends it to an Elasticsearch cluster and visualizes the results in Kibana dashboards.
More about Elastic Observability
Show on YouTube: What is Elastic Observability? or play it directly here.
Observability is the combination of Log analytics, Metrics analysis, Application performance analysis (APM) and availability monitoring called uptime.
Elastic APM is an application performance monitoring system built on the Elastic Stack. Elastic APM makes it easy to pinpoint and fix performance problems quickly. In this video, you will learn what traces are and how they can be used to better understand your applications.
All 4 categories of Observability can be done with the Elastic Stack. Kibana dashboards in this category showing how effective it is to correlate these 4 data sources into one singe view.