Terraform Multi Cloud Monitoring setup example
Terraforming cloud environments is becoming increasingly popular. It helps to build reliable infrastructure by defining all necessary Cloud components and services as code. At the same time more and more companies migrating their services into the Hyperscaler environments of Google, AWS and Azure. While this approach has a lot of advantages for the users it also leads to increased complexity in managing and monitoring all involved services. The Cloud provider monitoring templates that terraform Elasticsearch environments will help you by providing a great overview across your infrastructure.
It doesn’t matter whether you are operating one Cloud provider or complete Multi Cloud / Hybrid setup. Having a single point of view into all parts of your infrastructure is critical for success. However building those monitoring environments gets more complicated the more different components are involved.
Elastic Observability offers a lot of great tools that reduce the complexity. However setting Elastic up, especially in a cost effective way can be tricky. In order to run e.g. one monitoring cluster per cloud provider you have to set up a lot of things. Not only for Elastic but also within e.g. AWS there are a lot of things to do. That’s where the use of terraform can be very helpful. Terraform can not only create the Elastic Cloud cluster but also all necessary configurations and components within the Cloud Provider. Therefore terraform offers so called providers for each of the Hyperscalers like AWS, Azure and Google.
About the Elastic terraform examples project
The project is creating an Elastic Cloud environment in order to getting started with monitoring and protecting your Cloud Service Providers(CSP) environment in Google, AWS and/or Azure. It configures necessary services in the CSP environment as well as the in Elastic Cloud using terraform from Hashicorp. The whole process will be done in less than 1h.
You can either install every Cloud Environment separately or choose the Multi Cloud setup to install everything at once. When you choose Multi Cloud the terraform template will also configure the necessary connection between the clusters in order to do Cross Cluster Search(CCS). Because of that each cluster can live in its own Cloud Provider environment (GCP cluster in GCP, AWS cluster in AWS and so on). This will guarantee a low cost footprint when collecting the relevant data from the providers. But because of CCS every cluster can get queried by one main cluster.
Monitoring AWS
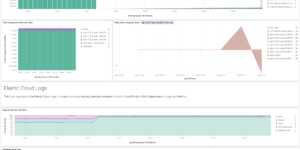
The AWS Elasticsearch terraform template creates an Elastic Cluster that is able to monitor your AWS environment. It creates all necessary AWS Components and the Elastic Cloud Cluster for you. The last task you need to do is to provide your AWS API account credentials that provide the right permissions as well as the Elastic Cloud API Key. It works both: In Elastic Cloud directly or via the AWS Marketplace option for Elastic Cloud.
The example will install and configure:
- Elastic Cluster
- AWS EC2 instance with Elastic Agent installed and configured to talk to the Elastic Cluster
- Elastic Agent will be configured to collect available Metric datasets with zero manual configuration
- Elastic SAR app will be used to install the elastic serverless forwarder to collect Logs from S3 and CloudWatch Log Groups
- The Elastic Cluster will be configured with the following additional capabilities
- Preloaded all Elastic Security Detection rules and enabled all AWS related rules
Monitoring Google Cloud (GCP)
The Google Cloud Elasticsearch terraform template creates an Elastic Cluster that monitors your Google Cloud environment. It creates needed Google Cloud components and the Elastic Cloud Cluster for you. The only thing you need to provide is an appropriate Google Cloud Service account that has the right permissions and the Elastic Cloud API Key. It works both: In Elastic Cloud directly or via the Google Cloud Marketplace option for Elastic Cloud.
This example will install and configure:
- Elastic Cluster
- Google Cloud Compute engine with Elastic Agent installed and configured to talk to the Elastic Cluster
- Google Cloud Log routers (Log sinks) with the appropriate filters for Audit, Firewall, VPC Flow, DNS and Loadbalancer Logs.
- Google Cloud PubSub topics to collects the log types above
- Elastic Agent will be configured to collect all the logs and all available Google Cloud Metric datasets with zero manual configuration
- The Elastic Cluster will be configured with the following additional capabilities
- Single pane of glass Google Cloud Dashboard
- Google Cloud Cost optimizer dashboard
- Google Cloud Storage bucket analyzer dashboard
- Elastic transforms to prepare the data for the installed dashboards
- Preloaded all Elastic Security Detection rules and enabled all Google Cloud related rules
Monitoring Azure
The Azure Elasticsearch terraform template creates an extended view in the monitoring and security data that’s existing within Microsoft Azure. It will create all necessary components like EventHubs within your Azure Account and also configure the Elastic components to collect data from them. One part of it is to collect Azure Billing data as to be able to create dashboards for Cost optimization. It takes just a few minutes to get it up and running. It works both: In Elastic Cloud directly or via the Azure Marketplace option for Elastic Cloud. See here how to get started with Elastic on Azure Marketplace without terraform.
This example will install and configure:
- Elastic Cluster
- Azure VM (Linux) with Elastic Agent installed and configured to talk to the Elastic Cluster
- Azure Diagnostic Settings for Platform and Activity Logs to send it to EventHubs
- Elastic Agent to collect all available Azure Metrics
- The Elastic Cluster will be configured with the following additional capabilities
- Preloaded all Elastic Security Detection rules and enabled all Google Cloud related rules
Monitor Multi Cloud and Hybrid environments
As you can see above this Elastic terraform example helps to get started with Monitoring of Azure, GCP and AWS. On of the great things of Elastic is that it can do the necessary monitoring within the environment the data is arising. Meaning that Azure monitoring data, like platform logs are collected in the Elastic Cluster that also lives in Azure. AWS monitoring data like CloudTrail logs or CloudWatch Metrics are collected in the Elastic Cluster that lives in AWS. Using Cross Cluster Search you can still bring all those data sources together in a single pane of glass by leveraging ideal resource distribution.
| Tested versions | 8.x |
| ECS compliant | Yes |
You must log in to submit a review.