
Kibana Dashboards Download overview
Kibana completes the data visualization of the ELK stack. This tool is used to visualize Elasticsearch documents and help developers quickly understand it. The Kibana dashboard provides a variety of interactive charts, geospatial data, and graphs to visualize complex queries. It can be used to search, view, and interact with data stored in the Elasticsearch directory. Kibana can help you perform advanced data analysis and visualize your data in various tables, charts, and maps. In Kibana, there are multiple ways to perform searches on your data. The following section shows a collection of Kibana objects like Kibana dashboards, visualizations and more.
Kibana Dashboards examples
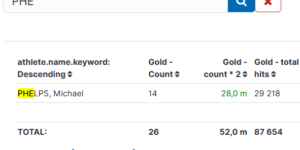
Kibana Enhanced Table plugin
Data Table visualization with enhanced features like computed columns, pivot table or filter bar

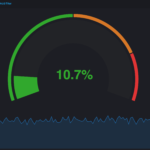
Vega Compound Gauge
This is a compund gauge visualization made with Vega. Its very helpful for visualization of percentage values.


Ask Me Anything Booth – Canvas Example
This is an example canvas page that shows how to visualize using canvas in general.

RUM extension dashboard
This dashboard provide deeper insight into the real user monitoring data collected by Elastic RUM.
More about Kibana Dashboards
With Kibana dashboards you can fulfill many different use cases like
- Powerful front-end dashboarding which is capable of visualizing indexed information from the elastic cluster
- Enables real-time search of indexed information and up to peta byte scale
- You can search, view, and interact with data stored in Elasticsearch
- Execute queries on data & visualize results in charts, tables, and maps
- Configurable dashboard to slice and dice logstash logs in elasticsearch
- Capable of providing historical data in the form of graphs, charts, etc.
- Real-time dashboards which is easily configurable
- Kibana ElasticSearch enables real-time search of indexed information
Using e.g. Kibana Canvas dashboards makes it easy to visualize any kind of information in seconds.