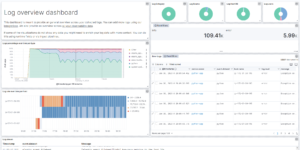
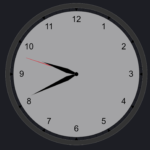
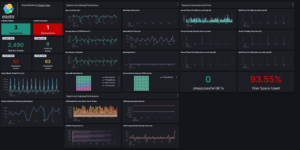
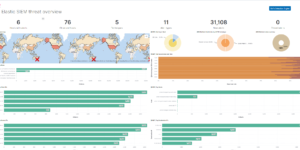
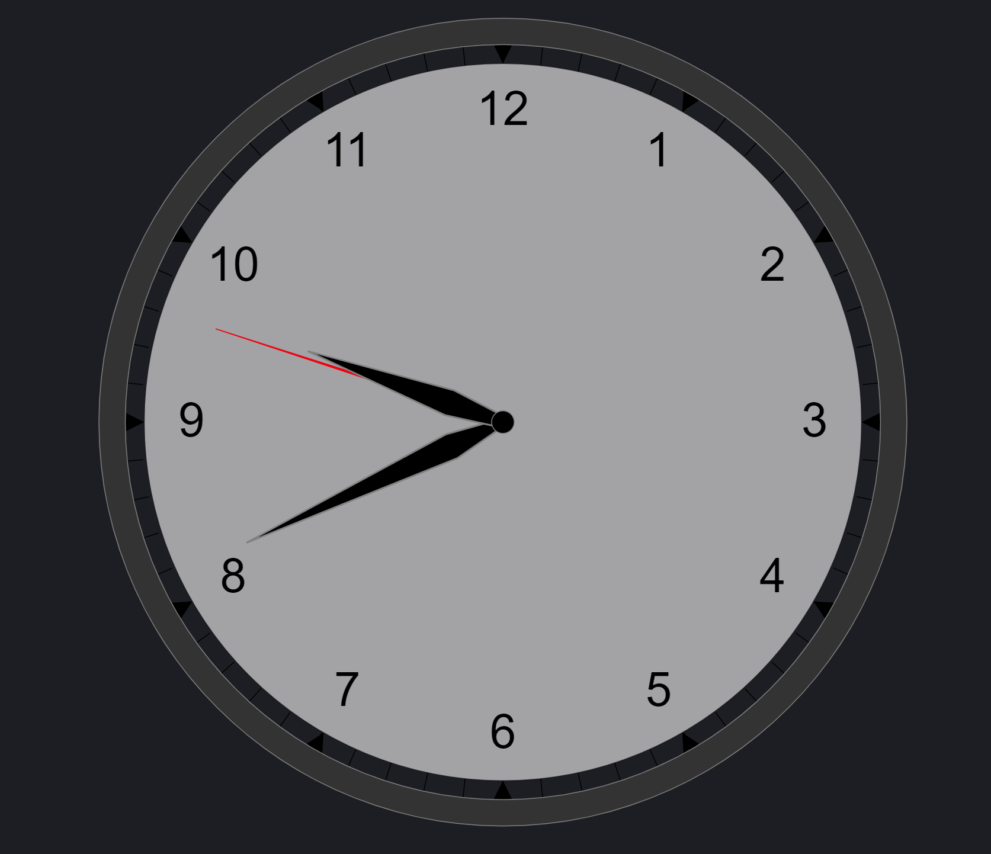
vega clock

Description

Use this clock visualization to compare different timezone within your dashboard. This helps to get better understanding of different time all around the globe. 

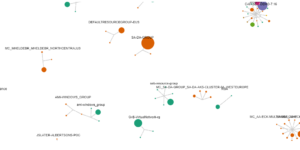
This visualization is build with Kibana Vega and can be used in your Kibana Dashboards or in Canvas.

Tested versions 7.x
ECS compliant

You must log in to submit a review.

Related downloads

Ingest Pipeline Monitoring

This Kibana dashboard can be used monitor your ingest pipelines

Vega Compound Gauge

This is a compund gauge visualization made with Vega. Its very helpful for visualization of percentage values.

Kubernetes architecture overview

Vega visualization to show the dependencies between the different Kubernetes components in a single visualization

osquery performance dashboard

Kibana Dashboard example to visualize osquery performance

Vega Scatterplot Kibana visualization

A scatterplot visualization made with Vega Lite for Kibana

Threat detection Kibana dashboard

Kibana dashboard example visualizing the results of the Elastic SIEM detection engine

These downloads could be also interesting for you

Crawler dashboard

A Kibana dashboard that visualizes the result of the crawler from Elastic Enterprise Search

Watcher History Dashboard

This dashboard shows the history of executed watcher jobs.

Ingest Pipeline Monitoring

This Kibana dashboard can be used monitor your ingest pipelines

AWS Cloudtrail Monitoring dashboard

Deep insights into AWS Cloudtrail events for SIEM and Monitoring

Data flow canvas

Average rating:

This canvas examples shows some possibilities of how to visualize data flows. Every flow can be activated / deactivated based on your Elasticsearch data.