

Office 365 dashboards
A collection of Kibana dashboards to provide a holistic view of Microsoft Office 365 environments


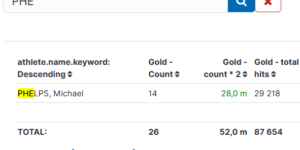
Kibana Enhanced Table plugin
Data Table visualization with enhanced features like computed columns, pivot table or filter bar
The search results are evaluated by ElasticPress using Elasticsearch clusters from Elastic Cloud.