ama-canvas

Description

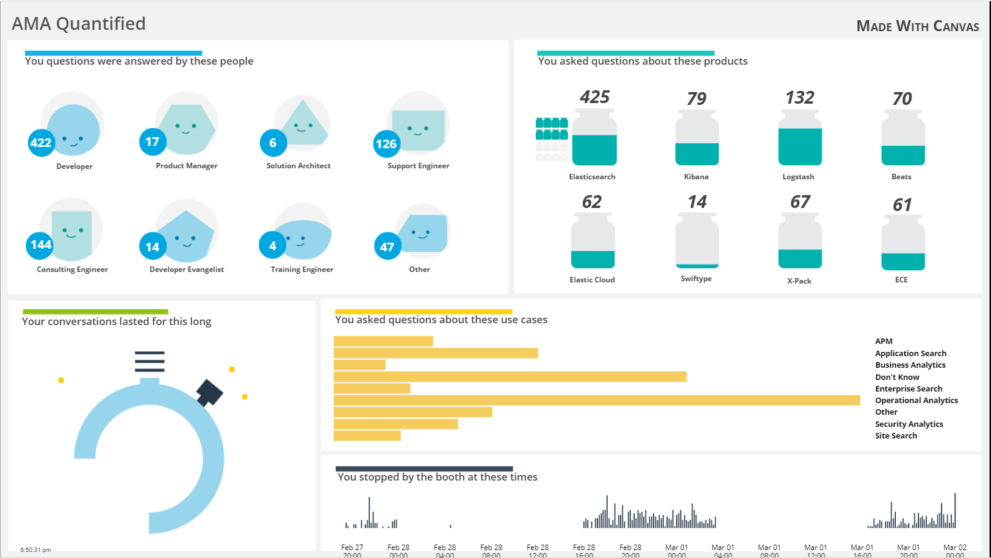
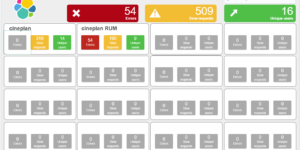
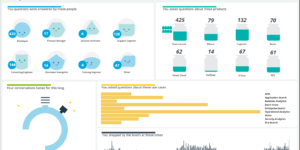
This is an example canvas page that show how to visualize using canvas in general. Its a simple dashboard but good to learn the basics.

Kibana Canvas is a great way to visualize your data in a very graphical way. Having the right pictures and graphics is very essential to make great live data visualizations.

Get more details from the source of this canvas example: https://github.com/elastic/examples/tree/master/canvas/ama

Tested versions 7.9
ECS compliant

You must log in to submit a review.
Related downloads

Data flow canvas

Average rating:

This canvas examples shows some possibilities of how to visualize data flows. Every flow can be activated / deactivated based on your Elasticsearch data.

Crawler dashboard

A Kibana dashboard that visualizes the result of the crawler from Elastic Enterprise Search

osquery performance dashboard

Kibana Dashboard example to visualize osquery performance

Vega Compound Gauge

This is a compund gauge visualization made with Vega. Its very helpful for visualization of percentage values.

Ingest Pipeline Monitoring

This Kibana dashboard can be used monitor your ingest pipelines

These downloads could be also interesting for you

Sankey visualization example

This is an example of how to build an sankey visualization using the vega visualization in Kibana.

Elastic Cloud Billing data collection and Kibana dashboard

Pulls Elastic Cloud Billing information from the Billing API then sends it to an Elasticsearch cluster and visualizes the results in Kibana dashboards.

PI Hole Logstash Pipeline and Dashboard

A filter for Logstash parsing PI-Hole logs + Dashboard to visualize the data

Threat detection Kibana dashboard

Kibana dashboard example visualizing the results of the Elastic SIEM detection engine

Elastic Stack Monitoring Dashboard

Kibana dashboards that is showing the monitoring data collected by Elastics in built monitoring capabilities.

osquery performance dashboard

Kibana Dashboard example to visualize osquery performance