Description
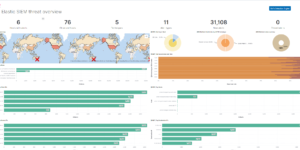
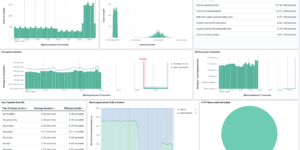
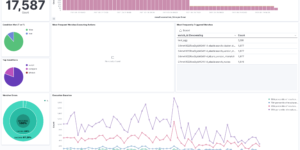
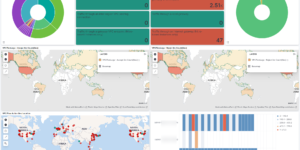
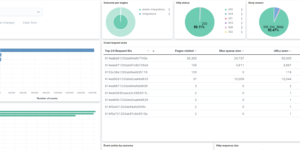
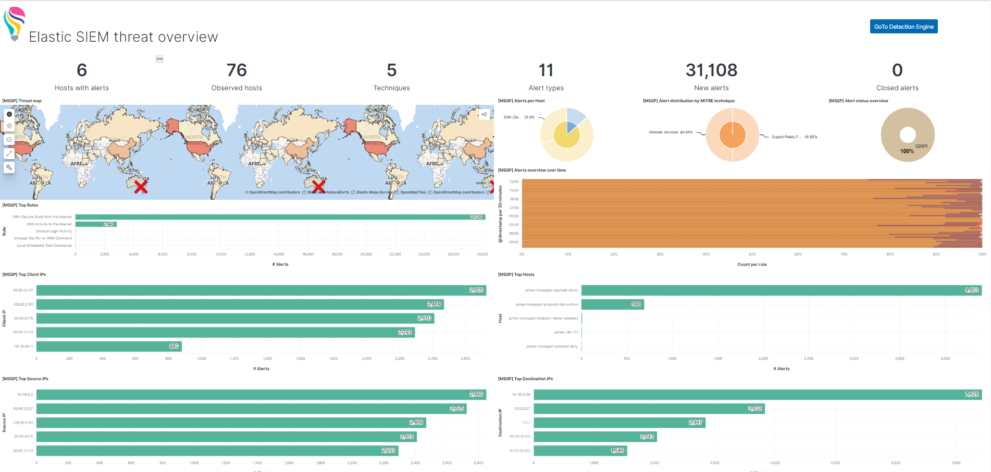
This Kibana dashboard example is visualizing the results of the Elastic SIEM detection engine. We also have a similar version of this dashboard using Kibana canvas. The Elastic SIEM detection engine is a great way to analyze all the cybersecurity related data you have stored in your Elastic Security installation. You can use it for your SIEM related as well as for your Elastic Endpoint related data.
The idea of the dashboard is to highly aggregate the results of the detection engine. Every alert that is created by the detection engine is a possible threat. However there can be many of them depending on the amount and criticality of systems you observe. Being able to get these results, aggregating and visualizing it even further than the Elastic Stack is doing it OOTB is one of the big strength that the Elastic Stack has. However getting to this point as a new user takes some time.
This Kibana dashboard will help you to identify threats and observe the results of the detection engine from day 1.
What is the Elastic SIEM detection engine?
The detection engine provides SOC teams with a complete SIEM rule experience within the free Elastic SIEM. The detection engine draws from a purpose-built set of Elasticsearch analytics engines and runs on a new distributed execution platform in Kibana.
Prebuilt rules
Rules can be difficult to develop and require a lot of time to test. Therefore, the detection started with a lot of prebuilt rules developed by Elastic Security’s intelligence and analysis team and has been widely used in Elastic’s production environment. New rules to respond to the latest critical threats are constantly being developed. Getting them loaded and ready to run is as simple as clicking a button! Using the Elastic content share you can also load a big chunk of detection rules next to the ones delivered by Elastic.
| Tested versions | 7.13 |
| ECS compliant | Yes |
You must log in to submit a review.