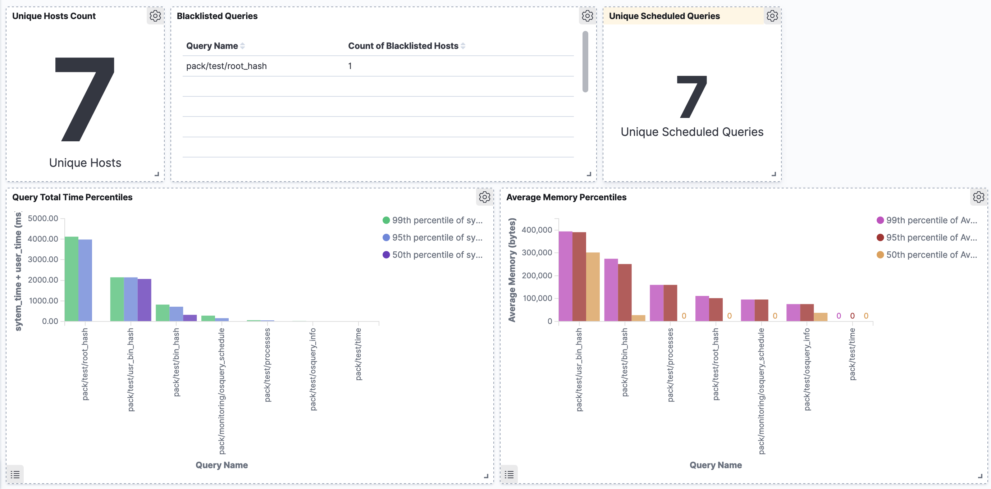
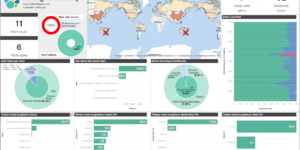
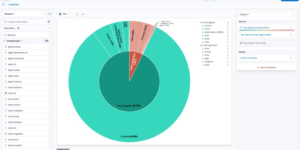
osquery kibana dashboard

Description

This is an Kibana dashboard example visualizing performance metrics of osquery. The example has been created as part of this blog article. In order to get the right data for the dashboard you need to follow the guide in that article.

The recommended way to get osquery data into Elasticsearch is using the Filebeat module

What is osquery?

osquery is a SQL powered operating system instrumentation, monitoring, and analytics framework.

osquery exposes the operating system as a high-performance relational database. This allows you to write SQL-based queries to browse operating system data. With osquery, SQL tables represent abstract concepts such as running processes, loaded kernel modules, open network connections, browser plug-ins, hardware events, or file hashing. SQL tables are implemented through simple plug-ins and extension APIs. Various tables already exist, and more are being written: https://osquery.io/schema.

Source

Originally found at https://medium.com/fleetdm/build-an-osquery-performance-dashboard-1b1762ee3880

Tested versions 7.13
ECS compliant No

You must log in to submit a review.
Related downloads

Elasticsearch Performance Troubleshooting Kit

Download the Elasticsearch Performance Troubleshooting Kit to efficiently diagnose and resolve slow query issues in your Elasticsearch environment.

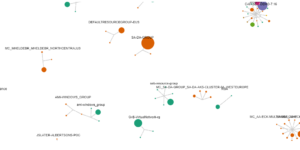
CMDB dependency in Kibana Dashboard

Kibana vega example to show how to load visualize relationships between different infrastructure and network components in vega.

Vega Clock UTC

This is a working clock visualization in UTC time.

osquery performance dashboard

Kibana Dashboard example to visualize osquery performance

Vega Compound Gauge

This is a compund gauge visualization made with Vega. Its very helpful for visualization of percentage values.

These downloads could be also interesting for you

Elasticsearch Performance Troubleshooting Kit

Download the Elasticsearch Performance Troubleshooting Kit to efficiently diagnose and resolve slow query issues in your Elasticsearch environment.

Traffic light using Vega

This traffic light visualizations is build with vega. The thresholds can be defined via values within the document itself.

OpenSIEM Logstash Parsing

Logstash Parsing Configurations for Elastic SIEM parses many different sources into ECS

Data flow canvas

Average rating:

This canvas examples shows some possibilities of how to visualize data flows. Every flow can be activated / deactivated based on your Elasticsearch data.

Kibana Enhanced Table plugin

Data Table visualization with enhanced features like computed columns, pivot table or filter bar

Azure billing data network

A vega visualization that shows the connection between resource group, resource type and the resource itself based on Elastic agent azure billing data integration.