HELLO WORLD
Webs;
Blogs;
Sosial Media;
| Tested versions | |
| ECS compliant |
You must log in to submit a review.
| Tested versions | |
| ECS compliant |
You must log in to submit a review.
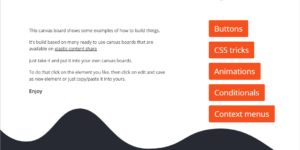
A collection of canvas examples, like using conditionals, creating buttons, animations or context menues. Just copy paste into your Kibana Canvas project.

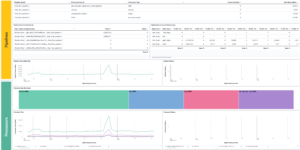
Kibana Canvas dashboard that shows an aggregated view on the results of the detection engine in Elastic Security.

This canvas examples shows some possibilities of how to visualize data flows. Every flow can be activated / deactivated based on your Elasticsearch data.
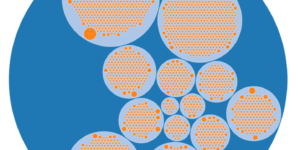
Vega visualization to show the dependencies between the different Kubernetes components in a single visualization

Dashboard to monitor GCP resources using different metrics and logs.
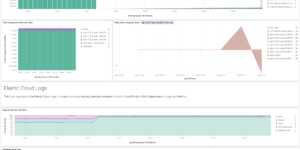
Kibana dashboard that uses the Elastic Cloud monitoring data to provide better insights into what’s happening in your cloud environment.

Kibana canvas example showing an office screen with weather, news and stock information
A collection of rules based on the Sigma rules for AWS based on the Filebeat AWS module and Elastic agent integration.
Watcher job to integrate ChatGPT API from OpenAI in Elasticsearch. Helpful to find solutions for error messages very quick.
A collection of rules based on the Sigma detection rules for proxy server and web server looks, e.g. zeek or suricata.