Description
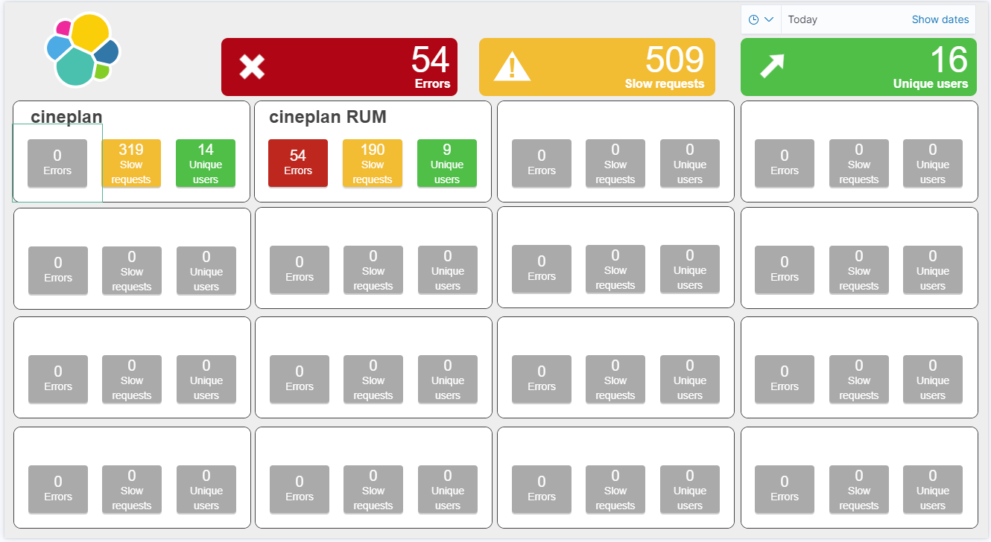
This canvas dashboards shows the status of services in Elastic APM as traffic lights.
This canvas is adaptive based on the number of services that you are observing with Elastic APM. You can have between 1 and 16 services. Every app based traffic light is also a drill down button. The buttons are linking to one of your dashboards. You configure the target dashboard with global variables. Take care that the dashboard can work with APM data.
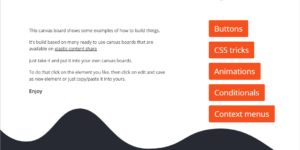
You can also use this canvas example to learn more about how to use canvas variables, conditionals and custom drilldowns.
This Kibana canvas example can be used to learn how to
- build traffic lights in Canvas using conditionals
- use multiple requests in one expression (element)
- dynamically add content Kibana canvas elements
- use global and expression based variables
- configure dynamic links to Kibana objects
Configuration
This canvas has global variables set to configure a few things:
dashboard_id: The ID of the dashboard that you would like to link to.
kibana_space_id: The Kibana space ID of the dashboard that you would like to link.
label_red_box: This is the label text for every red box.
label_yellow_box: This is the label text for every yellow box.
label_green_box: This is the label text for every green box.
| Tested versions | 7.x, 7.1, 7.2, 7.3, 7.4, 7.5, 7.6, 7.7, 7.8, 7.9, 7.10 |
| ECS compliant |
Reviews
Just uploaded it into my Kibana and it immediatly works! That helps a lot!!
Thank you for your feedback.
452 of 915 people found this review helpful.
You must log in to submit a review.