Filebeat log analysis dashboard

Description

Using the Elastic Stack ( or formerly known as ELK stack) for log analysis is very common. Many people using the ELK stack for log centralization, log aggregation and log collection use cases because its easy, scalable and the users can start for free.

Also you have a centralized view built for infrastructure operations, all logs flowing in from servers, virtual machines, and containers are kept in sync. Fix structured fields such as IP or event type, and browse related logs without leaving the current screen. Dive into the Logs application in Kibana and get a console-like experience in all logs-real-time streaming.

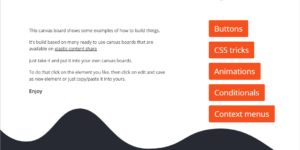
However sometimes it useful to build your own view into the log data. That where Kibana dashboards and Canvas boards can help you. The Elastic Stack offers many pre built Kibana dashboards for Logs within their Filebeat modules. While this is great it’s also cool to have a look into the data using Canvas.

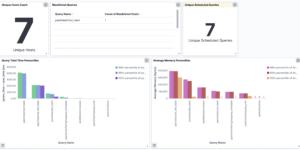
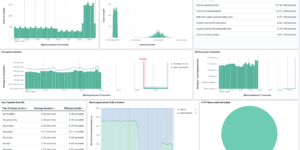
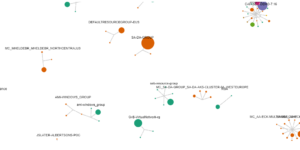
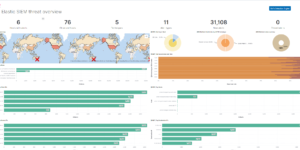
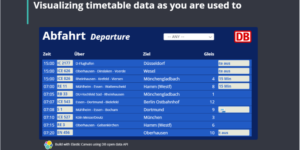
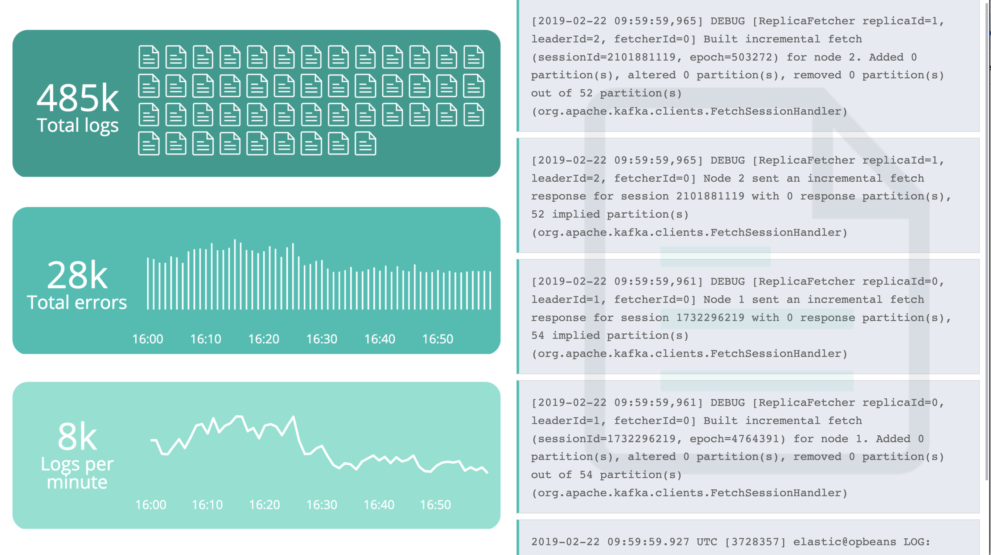
This Kibana canvas dashboard is visualizing the Filebeat logs in Kibana. You only need to upload it into your ELK cluster.

Source

This dashboard was found here: https://github.com/alexfrancoeur/kibana_canvas_examples

Tested versions 7.x
ECS compliant

You must log in to submit a review.

Related downloads

Office 365 dashboards

A collection of Kibana dashboards to provide a holistic view of Microsoft Office 365 environments

Ask Me Anything Booth – Canvas Example

This is an example canvas page that shows how to visualize using canvas in general.

Elasticsearch Performance Troubleshooting Kit

Download the Elasticsearch Performance Troubleshooting Kit to efficiently diagnose and resolve slow query issues in your Elasticsearch environment.

Office display canvas example

Kibana canvas example showing an office screen with weather, news and stock information

Detection engine alerts overview dashboard

Average rating:

Kibana Canvas dashboard that shows an aggregated view on the results of the detection engine in Elastic Security.

Threat detection Kibana dashboard

Kibana dashboard example visualizing the results of the Elastic SIEM detection engine

These downloads could be also interesting for you

Filebeat Suricata Canvas dashboard

A Kibana Canvas dashboard example that visualizes suricata logs collected with Filebeat.

Coffee Canvas Example

Kibana Canvas example infographic to show coffee consumption on a wallboard

Office display canvas example

Kibana canvas example showing an office screen with weather, news and stock information

Kibana Canvas examples collection

Average rating:

A collection of canvas examples, like using conditionals, creating buttons, animations or context menues. Just copy paste into your Kibana Canvas project.

Filebeat Log analysis canvas example

This is a simple canvas dashboard example that analyzes logs created by Filebeat.

Data flow canvas

Average rating:

This canvas examples shows some possibilities of how to visualize data flows. Every flow can be activated / deactivated based on your Elasticsearch data.