timetable

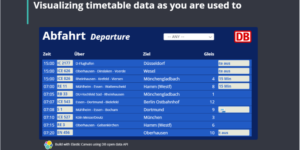
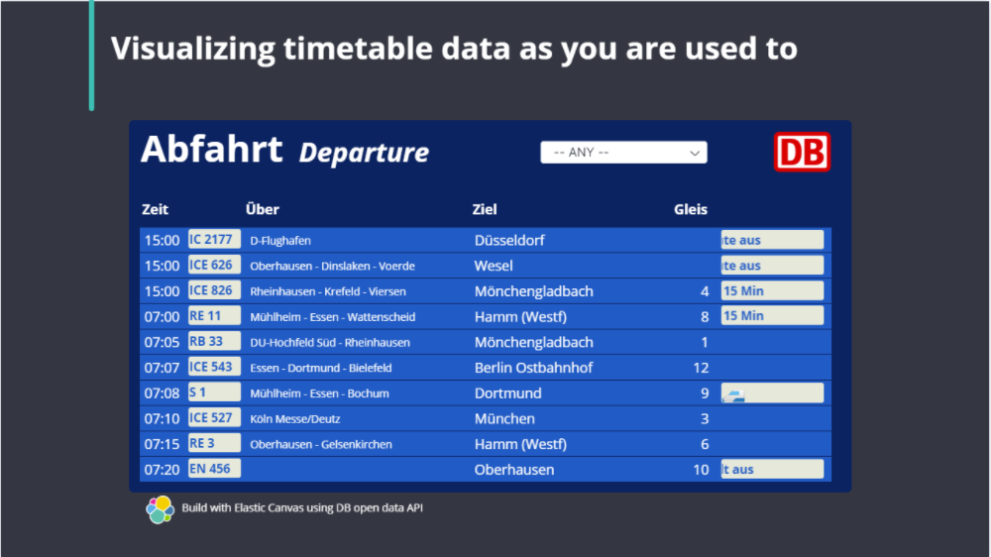
This canvas examples shows timetable data from german trains. Its build based on the real world information panel in german trian stations. Its refreshing based on current time. You can learn how to build a custom table format and also using some CSS tricks like creating marquee text.

The data source is the DB open data API. (https://developer.deutschebahn.com/store/apis/list)

Tested versions 7.x
ECS compliant

You must log in to submit a review.

Related downloads

Timetable canvas

This canvas examples shows timetable data from trains. Its build based on the real world information panel in german trian stations. Its refreshing based on current time.

Coffee Canvas Example

Kibana Canvas example infographic to show coffee consumption on a wallboard

Detection engine alerts overview dashboard

Average rating:

Kibana Canvas dashboard that shows an aggregated view on the results of the detection engine in Elastic Security.

APM Services overview canvas

Average rating:

An adaptive turn key canvas example based on Elastic APM data.

Filebeat Suricata Canvas dashboard

A Kibana Canvas dashboard example that visualizes suricata logs collected with Filebeat.

Ask Me Anything Booth – Canvas Example

This is an example canvas page that shows how to visualize using canvas in general.

These downloads could be also interesting for you

Observability Kibana Dashboard

A single pane of glass dashboard for Logs, Metrics, APM data and business KPIs.

Elastic Cloud Monitoring dashboard

Kibana dashboard that uses the Elastic Cloud monitoring data to provide better insights into what’s happening in your cloud environment.

CMDB dependency in Kibana Dashboard

Kibana vega example to show how to load visualize relationships between different infrastructure and network components in vega.

Cloudflare Kibana dashboards

Cloudflare dashboards and ingest pipelines to visualize cloudflare logs

Data flow canvas

Average rating:

This canvas examples shows some possibilities of how to visualize data flows. Every flow can be activated / deactivated based on your Elasticsearch data.

PI Hole Logstash Pipeline and Dashboard

A filter for Logstash parsing PI-Hole logs + Dashboard to visualize the data