ama-canvas

Description

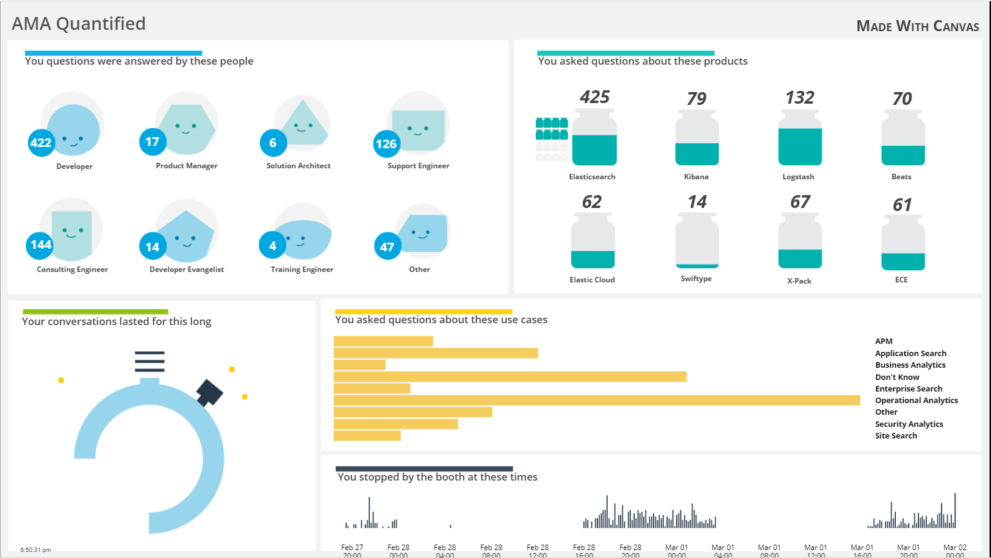
This is an example canvas page that show how to visualize using canvas in general. Its a simple dashboard but good to learn the basics.

Kibana Canvas is a great way to visualize your data in a very graphical way. Having the right pictures and graphics is very essential to make great live data visualizations.

Get more details from the source of this canvas example: https://github.com/elastic/examples/tree/master/canvas/ama

Tested versions 7.9
ECS compliant

You must log in to submit a review.

Related downloads

Filebeat Suricata Canvas dashboard

A Kibana Canvas dashboard example that visualizes suricata logs collected with Filebeat.

Office display canvas example

Kibana canvas example showing an office screen with weather, news and stock information

Ask Me Anything Booth – Canvas Example

This is an example canvas page that shows how to visualize using canvas in general.

Kibana Canvas examples collection

Average rating:

A collection of canvas examples, like using conditionals, creating buttons, animations or context menues. Just copy paste into your Kibana Canvas project.

Coffee Canvas Example

Kibana Canvas example infographic to show coffee consumption on a wallboard

Detection engine alerts overview dashboard

Average rating:

Kibana Canvas dashboard that shows an aggregated view on the results of the detection engine in Elastic Security.

These downloads could be also interesting for you

Kibana Canvas examples collection

Average rating:

A collection of canvas examples, like using conditionals, creating buttons, animations or context menues. Just copy paste into your Kibana Canvas project.

Detection engine alerts overview dashboard

Average rating:

Kibana Canvas dashboard that shows an aggregated view on the results of the detection engine in Elastic Security.

APM Services overview canvas

Average rating:

An adaptive turn key canvas example based on Elastic APM data.

Filebeat Log analysis canvas example

This is a simple canvas dashboard example that analyzes logs created by Filebeat.

Data flow canvas

Average rating:

This canvas examples shows some possibilities of how to visualize data flows. Every flow can be activated / deactivated based on your Elasticsearch data.

Google Cloud Log Ingestion dashboard

Canvas Board to analyze the log data collection of Google Cloud via Dataflow using the Google Cloud Metric module data