Security detections overview

Description

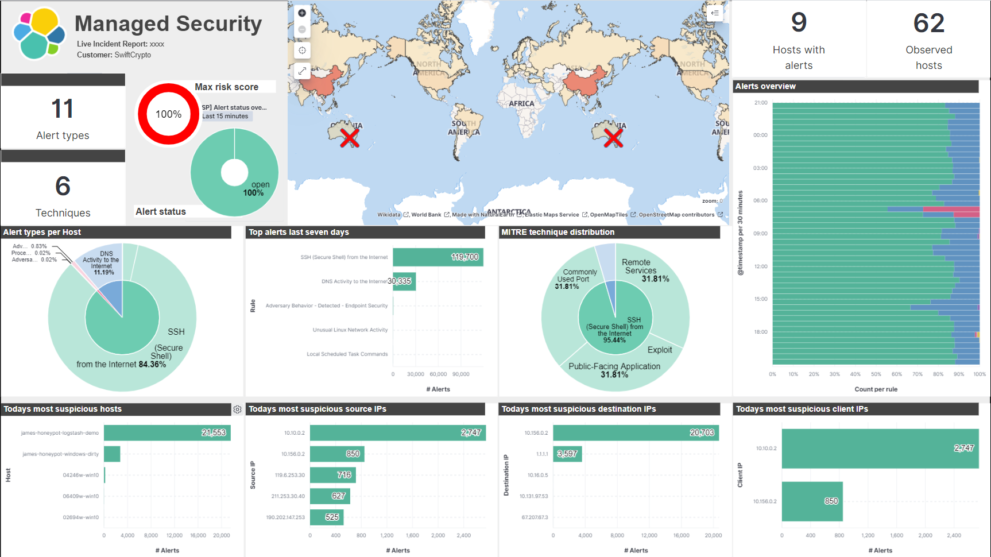
This Kibana Canvas Board aggregates the data of the Detection Engine that is part of Elastic Security. It comes we a set of pre build Kibana Lens visualizations that are aggregating the data. The user can decide to got with the Kibana Canvas board or use the visualizations to work with a normal Kibana Dashboard.

You will receive more than 10 visualizations + 2 index patterns next to the Canvas board.#

The Detection Engine of Elastic Security is detection suspicious behavior based on the MITRE ATTACK Framework. Its a very powerful tool to detect threats in the security related data that has been collected with the Elastic Stack. Nevertheless there is no out of the box view that shows the results of the alerts in an aggregated fashion. Thatswhy I build this Kibana dashboard to help users to understand the current situation.

Tested versions 7.11, 7.12, 7.13
ECS compliant Yes

Reviews

  • Great dashboard

    This dashboard really helps to aggregate the results of the detection engine. Now I always start looking at this dashboard and working myself through the open alerts.

    Thank you for your feedback.

    311 of 602 people found this review helpful.

  • Error on import

    Hi !

    I tried to import the dashboard in 7.10.2 and get an error regarding tag. As far as I know there is only in 7.11 tags. Is there a version for 7.10.2 available ?

    Thanks

    313 of 661 people found this review helpful.

    Help other customers find the most helpful reviews

    Did you find this review helpful? Yes No

  • You must log in to submit a review.
    Related downloads

    PI Hole Logstash Pipeline and Dashboard

    A filter for Logstash parsing PI-Hole logs + Dashboard to visualize the data

    Elasticsearch Performance Troubleshooting Kit

    Download the Elasticsearch Performance Troubleshooting Kit to efficiently diagnose and resolve slow query issues in your Elasticsearch environment.

    Azure billing data network

    A vega visualization that shows the connection between resource group, resource type and the resource itself based on Elastic agent azure billing data integration.

    RUM extension dashboard

    This dashboard provide deeper insight into the real user monitoring data collected by Elastic RUM.

    Detection engine alerts overview dashboard

    Average rating:

    Kibana Canvas dashboard that shows an aggregated view on the results of the detection engine in Elastic Security.

    Cloudflare Kibana dashboards

    Cloudflare dashboards and ingest pipelines to visualize cloudflare logs

    These downloads could be also interesting for you

    Kibana Maps with Open Weather Map

    This is the default basemap of Kibana incl. the Open Weather Map tile for temperature, wind and pressure

    Ask Me Anything Booth – Canvas Example

    This is an example canvas page that shows how to visualize using canvas in general.

    Kibana Enhanced Table plugin

    Data Table visualization with enhanced features like computed columns, pivot table or filter bar

    Vega Scatterplot Kibana visualization

    A scatterplot visualization made with Vega Lite for Kibana

    Sigma Zeek Detection rules

    A collection of rules based on the Sigma rules for Zeek based on the Filebeat Zeek module.

    Vega Clock UTC

    This is a working clock visualization in UTC time.