Description
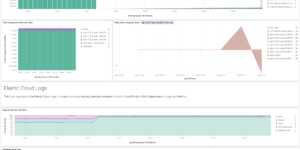
This Google Cloud Log Ingestion dashboard is visualizing many different metrics in a single architectural view. Its using the Data Flow Canvas Template as base. The target is to show the log events flow from Google Cloud Log Router via Pub / Sub topic and subscription to the dataflow job consumer into Elastic.
This canvas board shows the stream for Audit, Firewall, VPC Flow and DNS log data in Google Cloud. It is using global variables in order to set it up. For the audit stream it e.g. looks for objects that include the word “audit”. Which means that the log sink, the topic, the subscription and the dataflow job need to have this in the name.
There are also global variables to change the index of the data. It defaults to metric* and log* at the moment. If you are using different names in your Log Collection Setup or for your indices you need to change this variables within the Kibana Canvas Board.
I made all expressions aware of missing data. However it still shows error messages when the index pattern does not find any matching index.
To get data for all the services that get displayed here you need to configure the GCP Metric module with two generic metric data collectors.
- module: gcp
  metricsets:
    - metrics
  project_id: "xxx"
  credentials_file_path: "metricbeat-service-account.json"
  exclude_labels: false
  period: 1m
  metrics:
    - aligner: ALIGN_NONE
      service: dataflow
      metric_types:
        - "job/backlog_elements"
        - "job/status"
        - "job/per_stage_system_lag"
        - "job/pubsub/read_count"
        - "job/pubsub/write_count"
- module: gcp
  metricsets:
    - metrics
  project_id: "xxx"
  credentials_file_path: "metricbeat-service-account.json"
  exclude_labels: false
  period: 1m
  metrics:
    - aligner: ALIGN_NONE
      service: logging
      metric_types:
        - "exports/log_entry_count"
        - "exports/error_count"
- "exports/byte_count"| Tested versions | 7.x, 8.x |
| ECS compliant | Yes |
You must log in to submit a review.