Description

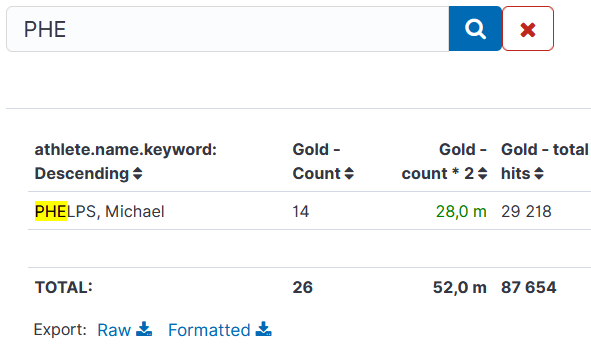
The plugin contains two visualizations:

  • Enhanced Table: for aggregated data (like Data Table visualization)
  • Document Table: for one document per line (kind of enhanced “Saved Search” feature)

Look at README to see whole features list.

To install it, read INSTALL NOTES.

Tested versions 5.x, 6.x, 7.1, 7.2, 7.3, 7.4, 7.5, 7.6, 7.7, 7.8, 7.9, 7.10, 7.11
ECS compliant

You must log in to submit a review.

Related downloads

Ask Me Anything Booth – Canvas Example

This is an example canvas page that shows how to visualize using canvas in general.

Office display canvas example

Kibana canvas example showing an office screen with weather, news and stock information

Resource Optimization Dashboard

Elastic Resource Optimization Dashboard to seamlessly integrate APM insights with cloud cost data for actionable resource management and cost-saving strategies

Kibana Enhanced Table plugin

Data Table visualization with enhanced features like computed columns, pivot table or filter bar

Ingest Pipeline Monitoring

This Kibana dashboard can be used monitor your ingest pipelines

Filebeat Suricata Canvas dashboard

A Kibana Canvas dashboard example that visualizes suricata logs collected with Filebeat.

These downloads could be also interesting for you

osquery performance dashboard

Kibana Dashboard example to visualize osquery performance

Sigma detection rules for proxy server logs

A collection of rules based on the Sigma detection rules for proxy server and web server looks, e.g. zeek or suricata.

Kibana Enhanced Table plugin

Data Table visualization with enhanced features like computed columns, pivot table or filter bar

Kibana Maps with Open Weather Map

This is the default basemap of Kibana incl. the Open Weather Map tile for temperature, wind and pressure

Vega Compound Gauge

This is a compund gauge visualization made with Vega. Its very helpful for visualization of percentage values.