Description

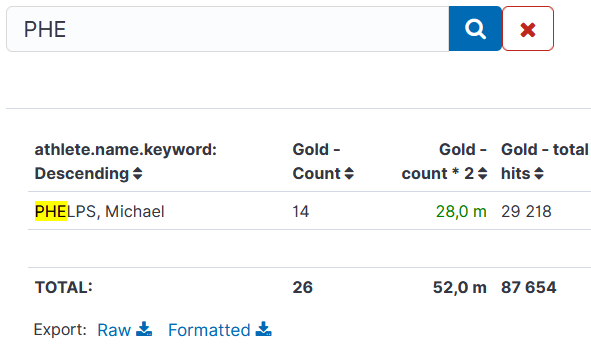
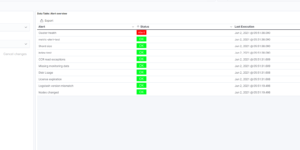
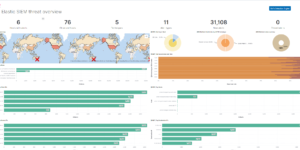
The plugin contains two visualizations:

  • Enhanced Table: for aggregated data (like Data Table visualization)
  • Document Table: for one document per line (kind of enhanced “Saved Search” feature)

Look at README to see whole features list.

To install it, read INSTALL NOTES.

Tested versions 5.x, 6.x, 7.1, 7.2, 7.3, 7.4, 7.5, 7.6, 7.7, 7.8, 7.9, 7.10, 7.11
ECS compliant

You must log in to submit a review.
Related downloads

Elastic Stack Monitoring Dashboard

Kibana dashboards that is showing the monitoring data collected by Elastics in built monitoring capabilities.

Google Cloud monitoring dashboard

Dashboard to monitor GCP resources using different metrics and logs.

Filebeat Log analysis canvas example

This is a simple canvas dashboard example that analyzes logs created by Filebeat.

Vega advanced heat map

Vega example to show GitHub commits per author per hour of day.

Ingest Pipeline Monitoring

This Kibana dashboard can be used monitor your ingest pipelines

These downloads could be also interesting for you

Kibana alerting enhancement

This bundle enhances the Kibana alerting experience. Storing all relevant information in indices and visualize the data in dashboards.

Google Cloud Log Ingestion dashboard

Canvas Board to analyze the log data collection of Google Cloud via Dataflow using the Google Cloud Metric module data

Sigma Zeek Detection rules

A collection of rules based on the Sigma rules for Zeek based on the Filebeat Zeek module.

Detection engine alerts overview dashboard

Average rating:

Kibana Canvas dashboard that shows an aggregated view on the results of the detection engine in Elastic Security.

Vega Clock UTC

This is a working clock visualization in UTC time.