Description

The plugin contains two visualizations:

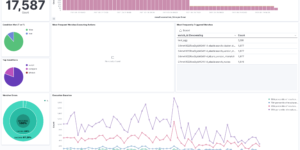
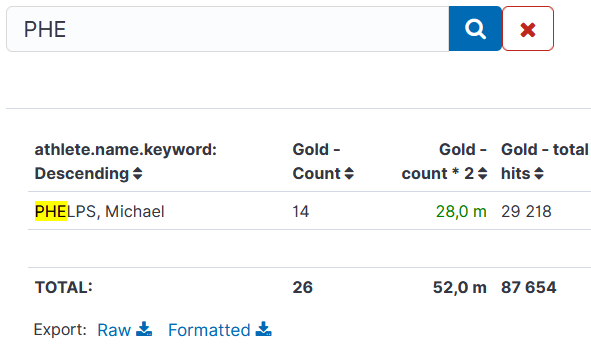
  • Enhanced Table: for aggregated data (like Data Table visualization)
  • Document Table: for one document per line (kind of enhanced “Saved Search” feature)

Look at README to see whole features list.

To install it, read INSTALL NOTES.

Tested versions 5.x, 6.x, 7.1, 7.2, 7.3, 7.4, 7.5, 7.6, 7.7, 7.8, 7.9, 7.10, 7.11
ECS compliant

You must log in to submit a review.

Related downloads

Filebeat Suricata Canvas dashboard

A Kibana Canvas dashboard example that visualizes suricata logs collected with Filebeat.

Vega Scatterplot Kibana visualization

A scatterplot visualization made with Vega Lite for Kibana

Filebeat Log analysis canvas example

This is a simple canvas dashboard example that analyzes logs created by Filebeat.

RUM extension dashboard

This dashboard provide deeper insight into the real user monitoring data collected by Elastic RUM.

Vega Clock UTC

This is a working clock visualization in UTC time.

CMDB dependency in Kibana Dashboard

Kibana vega example to show how to load visualize relationships between different infrastructure and network components in vega.

These downloads could be also interesting for you

Sigma Windows inbuilt detection rules

A collection of rules based on the Sigma rules for Windows (inbuilt folder) based on Winlogbeat data .

Cloudflare Kibana dashboards

Cloudflare dashboards and ingest pipelines to visualize cloudflare logs

AWS Cloudtrail Monitoring dashboard

Deep insights into AWS Cloudtrail events for SIEM and Monitoring

Watcher History Dashboard

This dashboard shows the history of executed watcher jobs.

Kubernetes architecture overview

Vega visualization to show the dependencies between the different Kubernetes components in a single visualization

Sigma detection rules for proxy server logs

A collection of rules based on the Sigma detection rules for proxy server and web server looks, e.g. zeek or suricata.