Kibana Downloads

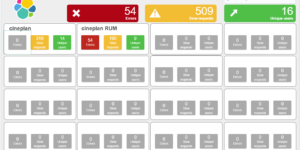
With this vega traffic light visualization you can build very dynamic traffic lights.

This example is made to show how to use document values to determine the threshold for switching colors from red to green. It also shows how to link to other objects by clicking on the traffic light.

Pretty easy but pretty useful. There are also other ways to build traffic lights within Kibana but this is the most flexible one.

Tested versions 6.x, 7.x
ECS compliant

You must log in to submit a review.

Related downloads

Coffee Canvas Example

Kibana Canvas example infographic to show coffee consumption on a wallboard

Vega Compound Gauge

This is a compund gauge visualization made with Vega. Its very helpful for visualization of percentage values.

Traffic light using Vega

This traffic light visualizations is build with vega. The thresholds can be defined via values within the document itself.

Cloudflare Kibana dashboards

Cloudflare dashboards and ingest pipelines to visualize cloudflare logs

Elastic Cloud Monitoring dashboard

Kibana dashboard that uses the Elastic Cloud monitoring data to provide better insights into what’s happening in your cloud environment.

Sigma detection rules for proxy server logs

A collection of rules based on the Sigma detection rules for proxy server and web server looks, e.g. zeek or suricata.

These downloads could be also interesting for you

Resource Optimization Dashboard

Elastic Resource Optimization Dashboard to seamlessly integrate APM insights with cloud cost data for actionable resource management and cost-saving strategies

AWS Cloudtrail Monitoring dashboard

Deep insights into AWS Cloudtrail events for SIEM and Monitoring

Sigma AWS Cloudtrail Detection rules

A collection of rules based on the Sigma rules for AWS based on the Filebeat AWS module and Elastic agent integration.

Kibana Canvas examples collection

Average rating:

A collection of canvas examples, like using conditionals, creating buttons, animations or context menues. Just copy paste into your Kibana Canvas project.

Observability Kibana Dashboard

A single pane of glass dashboard for Logs, Metrics, APM data and business KPIs.

Elastic Cloud Billing data collection and Kibana dashboard

Pulls Elastic Cloud Billing information from the Billing API then sends it to an Elasticsearch cluster and visualizes the results in Kibana dashboards.