
OpenSIEM Logstash Parsing
Logstash Parsing Configurations for Elastic SIEM parses many different sources into ECS
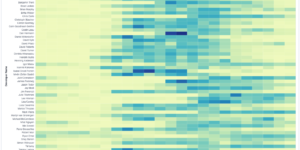
Sigma detection rules for proxy server logs
A collection of rules based on the Sigma detection rules for proxy server and web server looks, e.g. zeek or suricata.


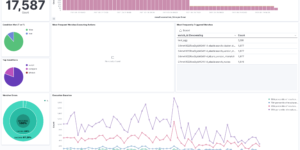
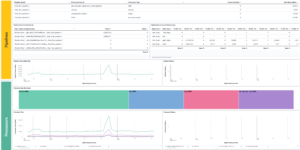
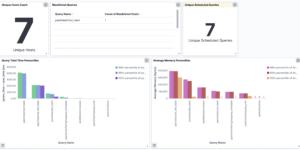
Elastic Cloud Billing data collection and Kibana dashboard
Pulls Elastic Cloud Billing information from the Billing API then sends it to an Elasticsearch cluster and visualizes the results in Kibana dashboards.
PI Hole Logstash Pipeline and Dashboard
A filter for Logstash parsing PI-Hole logs + Dashboard to visualize the data
The search results are evaluated by ElasticPress using Elasticsearch clusters from Elastic Cloud.