

Detection engine alerts overview dashboard
Kibana Canvas dashboard that shows an aggregated view on the results of the detection engine in Elastic Security.

Office 365 dashboards
A collection of Kibana dashboards to provide a holistic view of Microsoft Office 365 environments

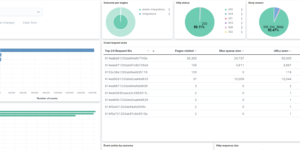
Crawler dashboard
A Kibana dashboard that visualizes the result of the crawler from Elastic Enterprise Search

Kibana alerting enhancement
This bundle enhances the Kibana alerting experience. Storing all relevant information in indices and visualize the data in dashboards.
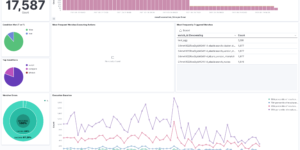
Cloudflare Kibana dashboards
Cloudflare dashboards and ingest pipelines to visualize cloudflare logs

Data flow canvas
This canvas examples shows some possibilities of how to visualize data flows. Every flow can be activated / deactivated based on your Elasticsearch data.

Elastic Cloud Billing data collection and Kibana dashboard
Pulls Elastic Cloud Billing information from the Billing API then sends it to an Elasticsearch cluster and visualizes the results in Kibana dashboards.
PI Hole Logstash Pipeline and Dashboard
A filter for Logstash parsing PI-Hole logs + Dashboard to visualize the data
The search results are evaluated by ElasticPress using Elasticsearch clusters from Elastic Cloud.