Elastic Watcher Dashboard

Description

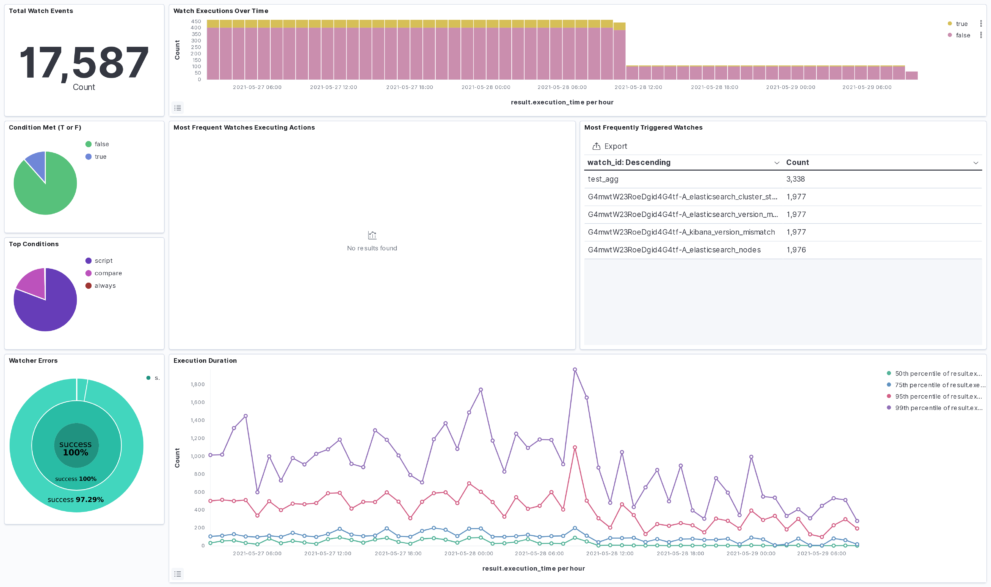
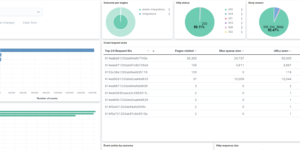
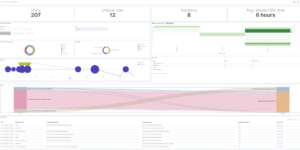
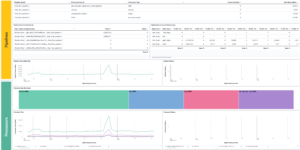
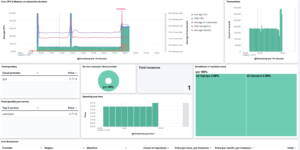
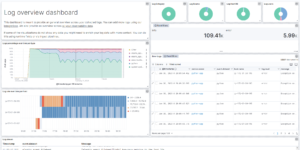
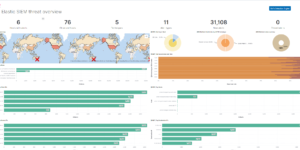
The Watcher History Dashboard shows the history of all the watcher jobs that are configured in your Elasticsearch deployment. This works by taking data from the system watcher history index that is created automatically when you are using watchers.

This is an Kibana example dashboard that can be easily extended based on your own needs. Also have a look into our Watcher job library if you need more information regardings watchers and what you can do with it.

Tested versions 7.12
ECS compliant

You must log in to submit a review.
Related downloads

Ask Me Anything Booth – Canvas Example

This is an example canvas page that shows how to visualize using canvas in general.

Azure billing data network

A vega visualization that shows the connection between resource group, resource type and the resource itself based on Elastic agent azure billing data integration.

RUM extension dashboard

This dashboard provide deeper insight into the real user monitoring data collected by Elastic RUM.

Crawler dashboard

A Kibana dashboard that visualizes the result of the crawler from Elastic Enterprise Search

Filebeat Log analysis canvas example

This is a simple canvas dashboard example that analyzes logs created by Filebeat.

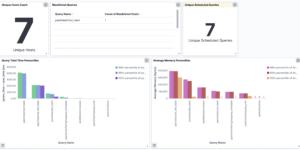
Watcher History Dashboard

This dashboard shows the history of executed watcher jobs.

These downloads could be also interesting for you

Elastic Cloud Billing data collection and Kibana dashboard

Pulls Elastic Cloud Billing information from the Billing API then sends it to an Elasticsearch cluster and visualizes the results in Kibana dashboards.

Ask Me Anything Booth – Canvas Example

This is an example canvas page that shows how to visualize using canvas in general.

Data flow canvas

Average rating:

This canvas examples shows some possibilities of how to visualize data flows. Every flow can be activated / deactivated based on your Elasticsearch data.

Observability Kibana Dashboard

A single pane of glass dashboard for Logs, Metrics, APM data and business KPIs.

Google Cloud monitoring dashboard

Dashboard to monitor GCP resources using different metrics and logs.

PI Hole Logstash Pipeline and Dashboard

A filter for Logstash parsing PI-Hole logs + Dashboard to visualize the data