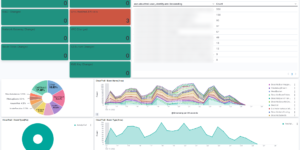
Elastic Cloud dashboard

Description

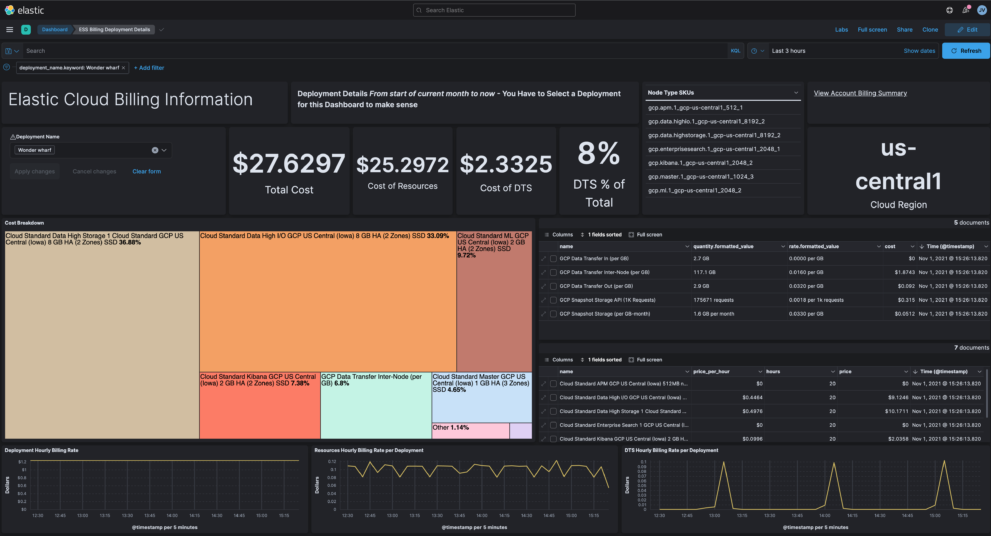
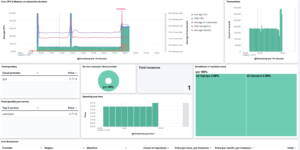
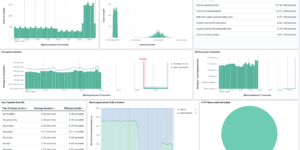
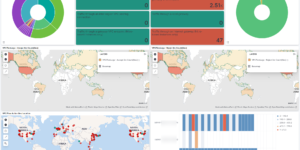
This download is visualizing billing information from Elastic Cloud in your Elastic Stack deployment. Its the ideal way to extend your monitoring cluster. The Elastic Cloud billing information including data about how much you spend per resource, cluster and or environment.

Depending on the section, info can include:

  • costs
    • total costs
    • hourly rate
    • DTS
  • resources
    • node type breakdown

You can find more information about the data that gets collected in the Elastic documentation. To collect the information you can use the script that is part of the source for this download. You can find that here.

Using the Elastic Cloud billing information you can analyse your costs and maybe find ways to reduce it.

Source

Originally found at GitHub: https://github.com/jeffvestal/ess-billing-ingest

Tested versions 7.15
ECS compliant No

You must log in to submit a review.
Related downloads

Elastic Stack Monitoring Dashboard

Kibana dashboards that is showing the monitoring data collected by Elastics in built monitoring capabilities.

Cloudflare Kibana dashboards

Cloudflare dashboards and ingest pipelines to visualize cloudflare logs

Vega Scatterplot Kibana visualization

A scatterplot visualization made with Vega Lite for Kibana

Elasticsearch Performance Troubleshooting Kit

Download the Elasticsearch Performance Troubleshooting Kit to efficiently diagnose and resolve slow query issues in your Elasticsearch environment.

Vega Clock UTC

This is a working clock visualization in UTC time.

Office 365 dashboards

A collection of Kibana dashboards to provide a holistic view of Microsoft Office 365 environments

These downloads could be also interesting for you

Impossible travel transform job

Impossible travel detection by calculating the distance between two login locations in combination with the time between the two logins

Ask Me Anything Booth – Canvas Example

This is an example canvas page that shows how to visualize using canvas in general.

Filebeat Log analysis canvas example

This is a simple canvas dashboard example that analyzes logs created by Filebeat.

Logstash Meraki Pipeline

Logstash Pipeline to load Meraki logs via Syslog into Elasticsearch

Elastic Stack Monitoring Dashboard

Kibana dashboards that is showing the monitoring data collected by Elastics in built monitoring capabilities.

Elasticsearch Performance Troubleshooting Kit

Download the Elasticsearch Performance Troubleshooting Kit to efficiently diagnose and resolve slow query issues in your Elasticsearch environment.