Coffee Canvas
Demo

Description

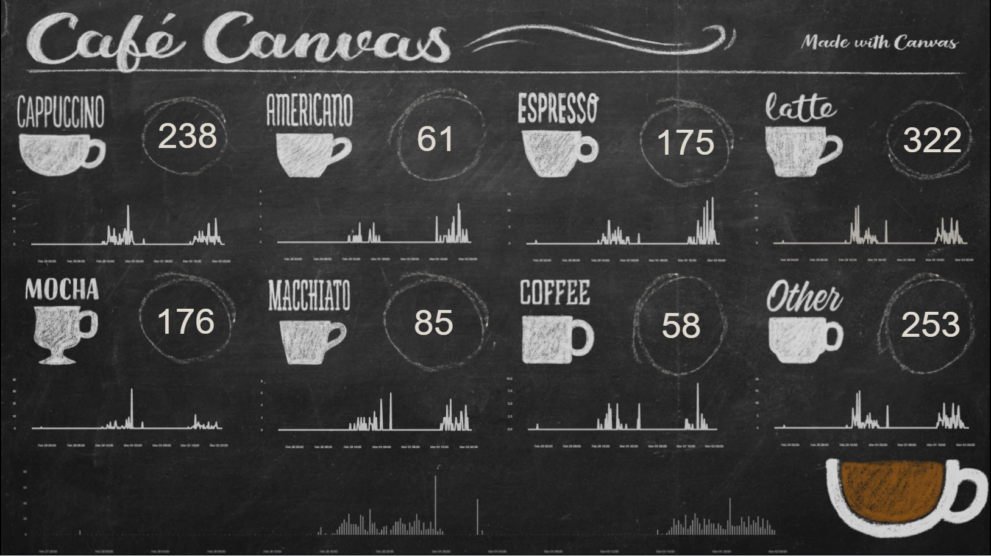
This is a Kibana Canvas example infographic that shows coffee consumption on a wallboard. It was originally shown at Elastic{ON} 2018 like the Ask me Anything canvas example.

The canvas example board consists of a couple of coffee pictures and illustrates the data using timelion data source. The download also delivers a chunk of testdata so that you can immediately see that its working.

Source

This example was originally found here: https://github.com/elastic/examples/tree/master/canvas/elasticoffee

Tested versions 7.13
ECS compliant No

You must log in to submit a review.

Related downloads

APM Services overview canvas

Average rating:

An adaptive turn key canvas example based on Elastic APM data.

Timetable canvas

This canvas examples shows timetable data from trains. Its build based on the real world information panel in german trian stations. Its refreshing based on current time.

Kibana Canvas examples collection

Average rating:

A collection of canvas examples, like using conditionals, creating buttons, animations or context menues. Just copy paste into your Kibana Canvas project.

Filebeat Suricata Canvas dashboard

A Kibana Canvas dashboard example that visualizes suricata logs collected with Filebeat.

Coffee Canvas Example

Kibana Canvas example infographic to show coffee consumption on a wallboard

Data flow canvas

Average rating:

This canvas examples shows some possibilities of how to visualize data flows. Every flow can be activated / deactivated based on your Elasticsearch data.

These downloads could be also interesting for you

Crawler dashboard

A Kibana dashboard that visualizes the result of the crawler from Elastic Enterprise Search

Elastic Stack Monitoring Dashboard

Kibana dashboards that is showing the monitoring data collected by Elastics in built monitoring capabilities.

Watcher History Dashboard

This dashboard shows the history of executed watcher jobs.

Cloudflare Kibana dashboards

Cloudflare dashboards and ingest pipelines to visualize cloudflare logs

Kubernetes architecture overview

Vega visualization to show the dependencies between the different Kubernetes components in a single visualization

AWS Cloudtrail Monitoring dashboard

Deep insights into AWS Cloudtrail events for SIEM and Monitoring