HELLO WORLD
Webs;
Blogs;
Sosial Media;
| Tested versions | |
| ECS compliant |
You must log in to submit a review.
| Tested versions | |
| ECS compliant |
You must log in to submit a review.

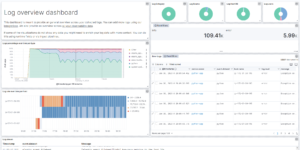
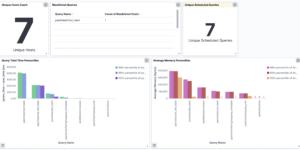
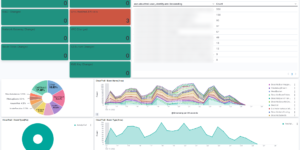
A single pane of glass dashboard for Logs, Metrics, APM data and business KPIs.

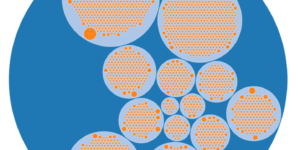
This canvas examples shows some possibilities of how to visualize data flows. Every flow can be activated / deactivated based on your Elasticsearch data.
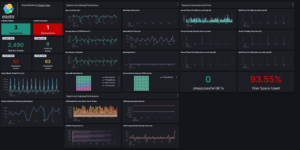
Kibana dashboards that is showing the monitoring data collected by Elastics in built monitoring capabilities.
Vega visualization to show the dependencies between the different Kubernetes components in a single visualization

Kibana Canvas dashboard that shows an aggregated view on the results of the detection engine in Elastic Security.
Deep insights into AWS Cloudtrail events for SIEM and Monitoring
This watch checks the availability of your Heartbeat observed services. It will trigger an alert whenever at least one of your services is down.
A watch which alerts if the time spent by a hosts CPU in IOWait, has increased by more than than N% in the last Y mins.