Elastic security

Description

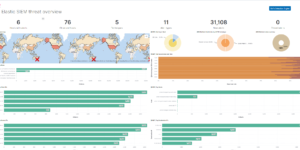
This are ACSC Advisory IOCs detection rules for Elastic SIEM.

The Australian Cyber Security Centre (ACSC) recently published an advisory outlining tactics, techniques and procedures used against multiple Australian businesses in a recent campaign by a state based actor.

SIEM rules were created using the list of IOCs published by the ACSC to detect and alert on a potential attack.

IOCs often change rapidly during campaigns and should not solely be relied upon for detections. However, it can be useful to maintain a list of IOCs in case other lines of defence are bypassed by the adversary.

Note that the SIEM rules currently run every 60 minutes, looking back at events from the last 60 minutes. The rules currently do not run actions for every execution. If you need to act on detections, it would be a good idea to set the frequency to Hourly rather than on each rule execution, to reduce the amount of noise created.

Here is a full blog post on the campaign and Elastic Security.

Source

Originally found here: https://github.com/elastic/examples/tree/master/Security%20Analytics/ACSC2020-008_IOCs

Tested versions 7.13
ECS compliant Yes

You must log in to submit a review.
Related downloads

Sigma AWS Cloudtrail Detection rules

A collection of rules based on the Sigma rules for AWS based on the Filebeat AWS module and Elastic agent integration.

AWS Cloudtrail Monitoring dashboard

Deep insights into AWS Cloudtrail events for SIEM and Monitoring

Threat detection Kibana dashboard

Kibana dashboard example visualizing the results of the Elastic SIEM detection engine

Office 365 dashboards

A collection of Kibana dashboards to provide a holistic view of Microsoft Office 365 environments

Sigma Sysmon detection rules

A collection of rules based on the Sigma detection rules for Windows Sysmon events based on Winlogbeat data.

OpenSIEM Logstash Parsing

Logstash Parsing Configurations for Elastic SIEM parses many different sources into ECS

These downloads could be also interesting for you

Elastic Stack Monitoring Dashboard

Kibana dashboards that is showing the monitoring data collected by Elastics in built monitoring capabilities.

Google Cloud Log Ingestion dashboard

Canvas Board to analyze the log data collection of Google Cloud via Dataflow using the Google Cloud Metric module data

Vega Compound Gauge

This is a compund gauge visualization made with Vega. Its very helpful for visualization of percentage values.

Coffee Canvas Example

Kibana Canvas example infographic to show coffee consumption on a wallboard

Sankey visualization example

This is an example of how to build an sankey visualization using the vega visualization in Kibana.

Elasticsearch Performance Troubleshooting Kit

Download the Elasticsearch Performance Troubleshooting Kit to efficiently diagnose and resolve slow query issues in your Elasticsearch environment.