Description
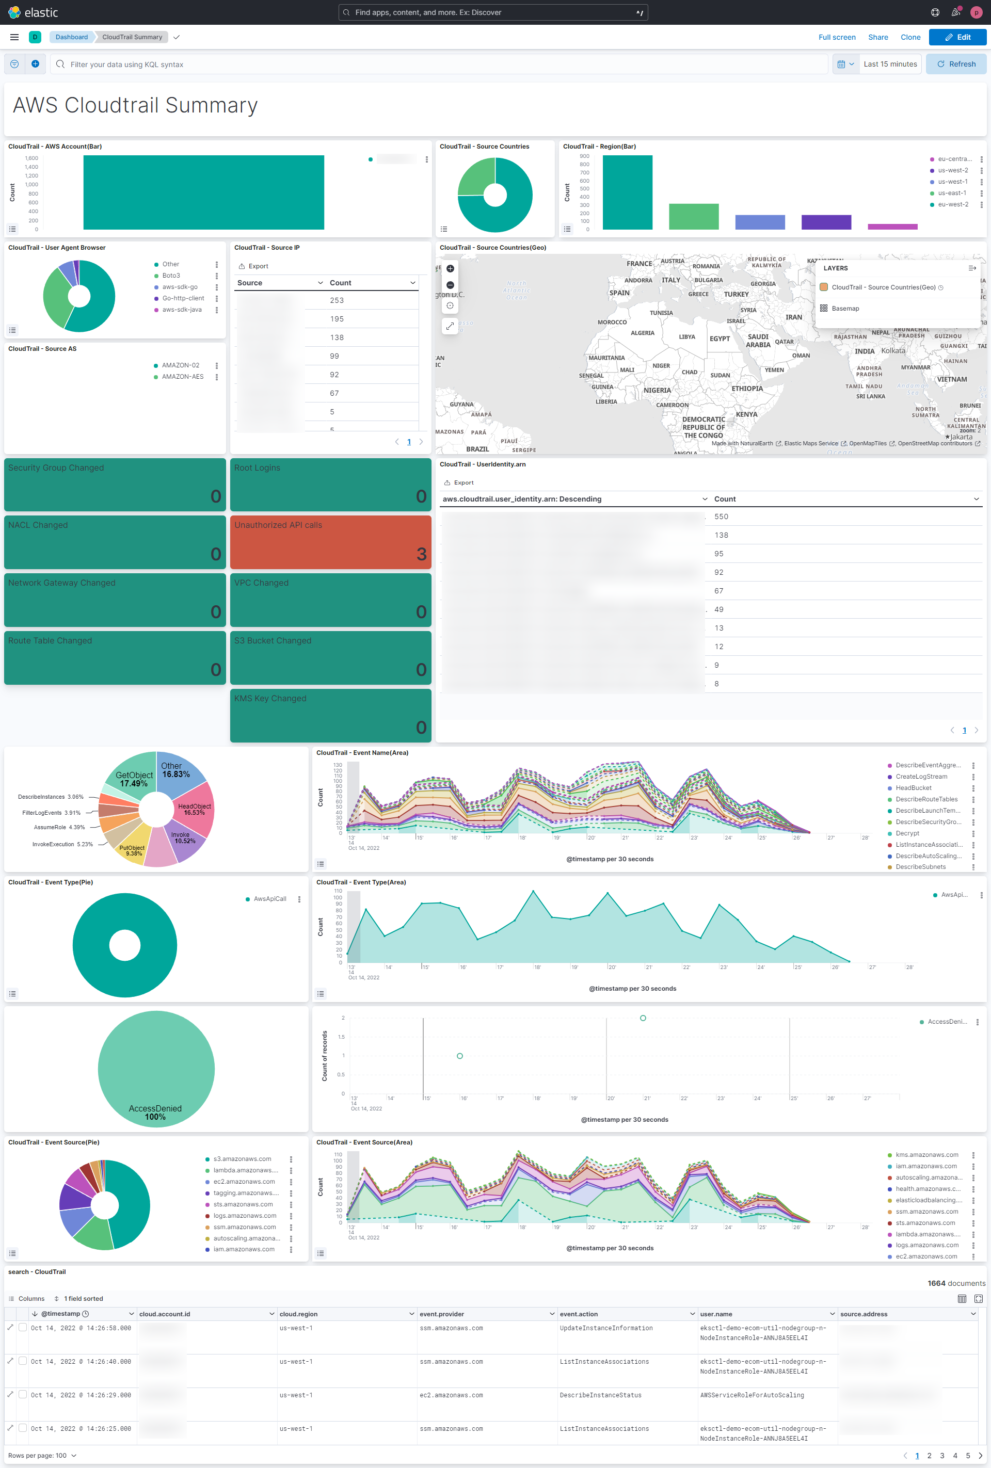
This AWS Cloudtrail Monitoring dashboard brings together all relevant information regarding AWS Cloudtrail. You can see what happens in your Cloud environment on a single dashboard. This helps to understand the AWS Cloudtrail information very easily.
This Kibana dashboard is based on the Elastic Agent integration that is delivered OOTB. The agent integration also includes an out of the box AWS Cloudtrail dashboard. However the dashboard that you can download here is more comprehensive to delivers immediate insights.
What is AWS Cloudtrail?
AWS CloudTrail enables auditing, security monitoring, and operational troubleshooting. CloudTrail records user activity and API calls across AWS services as events. CloudTrail events help you answer the questions of “who did what, where, and when?”
CloudTrail logs can be collected inter regional and from multiple accounts. This makes the adoption very easy. If you want to start without configuring much you can also use this terraform example to monitor all AWS logs and metrics.
With AWS Cloudtrail you can monitor, store, and validate activity events for authenticity. Easily generate audit reports required by internal policies and external regulations.
You also be able to detect unauthorized access using the Who, What, and When information . Respond with the power of Elastic Security to prevent any kind of security issues.
In Elastic you can continuously monitor API usage history using machine learning (ML) models to spot unusual activity in your AWS accounts, and determine root cause.
| Tested versions | 8.x |
| ECS compliant | Yes |
You must log in to submit a review.