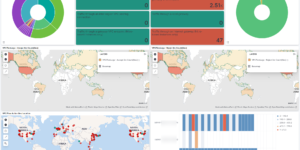
Description
An impossible travel is the detection of two logins to the same account from two very different locations in the world. This usually indicates that another person has used the same credentials on another place in the world. The detection of impossible travels can be done with very different techniques.
The simplest way is to check e.g. for a different country with logins that have a very short interval in between. However this can lead to very much false positives and is also not very precise because of the short interval between the two logins. Increasing the interval will increase the likelihood of false positives even more.
Another technique to detect impossible travels using login data is to e.g. check the amount of distinct country codes that user using per account. Every finding needs to get checked by an Security Analyst to check for false positives. So this approach is not ideal as well.
The Elastic Security Solution based on the Elastic Stack can do the two checks above for you and also check the behavior via Machine Learning techniques. If there is a possible finding Elastic Security also helps to identify whether its a real threat or not.
In addition to the above Elastic also offers to create transform jobs. Transforms help the user to pre analyze and aggregate the data for e.g. more sophisticated Machine Learning jobs and also for alerts. The Impossible travel transform job that you can download here is aggregating web log data per user. In addition to that it is checking the geographical distance between two login locations as well as the time in between. Based on that data the transform is also calculating the necessary speed to achieve that travel.
| Tested versions | 8.x |
| ECS compliant | Yes |
You must log in to submit a review.


