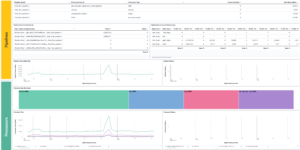
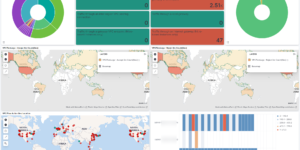
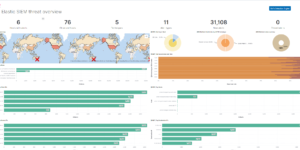
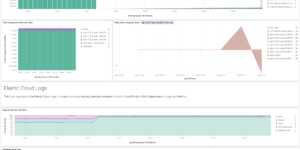
This download consists of Cloudflare Kibana dashboards example with the needed Ingest Node Pipeline and Index Template. Using this integration you have everything you need to analyse the logs from Cloudflare.
What is Cloudflare?
Cloudflare is one of the biggest networks operating on the Internet. People use Cloudflare services for the purposes of increasing the security and performance of their web sites and services. Cloudflare’s services sit between a website’s visitor and the Cloudflare customer’s hosting provider, acting as a reverse proxy for websites.
What are the Benefits of Cloudflare?
Using Cloudflare in front of your web application has a lot of benefits, like
- Protection Against Malicious Traffic
- Reduced Latency
- Reduced Server Load
- Universal SSL Certificate
How to setup the Kibana dashboard?
You can find the complete guide here.
Step 1 – Preparation
Before getting Cloudflare logs into Elastic you need to
- Install an AWS Lambda function, available in the file cloudflare-elastic-lambda.zip from GitHub at this location: https://github.com/cloudflare/cloudflare-elastic/releases/tag/v0.3-7.xOpen external link.
- Upload the cloudflare-elastic-lambda.zip file to an S3 bucket.
Step 2 – Deploy the contents from this download
Step 3 – Create the Lambda function in AWS
To create the Lambda function:
- Install the function: create the Lambda, which will read Cloudflare logs from S3 and import them into your Elastic cluster.
- Log in to your AWS console and navigate to the Lambda section. Create a new function, using the Java 8 runtime and give it a name such as cloudflare-elastic-logs.
- Configure the handler as
com.cloudflare.elastic.ElasticLambdaForwarder::handleRequestand upload the function that we had previously saved to our S3 bucket. - Configure the function. The Lambda function requires the following environment variables:
- elastic_hostname: Copy the Elasticsearch endpoint URL from your deployment. Remove the port number and https:// prefix; for example:
2202aa790db546268248a5bd1e35aea6.us-west1.gcp.cloud.es.io. - elastic_username: Enter elastic.
- elastic_password: Use the randomly generated password that was created for you.
- elastic_hostname: Copy the Elasticsearch endpoint URL from your deployment. Remove the port number and https:// prefix; for example:
- To connect your Cloudflare S3 log bucket. the last step is to tell the Lambda function to listen for events on the S3 bucket where your Cloudflare logs reside. Choose the S3 trigger type and configure it with the name of the S3 bucket. For Event type, select All object create events.
- Ensure your execution role is configured. In order for the function to be able to read logs from the S3 bucket, you may have to configure the execution role.
- View the execution role and add an inline policy that enables the function to read from the bucket.
- Give the policy a name and save it.
- Save the Lambda and start logging.
- Finally, save the Lambda configuration. Once it is saved, the Cloudflare logs will start showing up in Kibana on your Elastic Cloud deployment.
| Tested versions | 7.14 |
| ECS compliant | Yes |
You must log in to submit a review.