Description
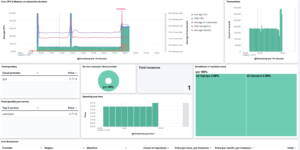
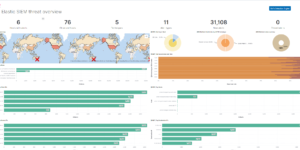
The Elastic Cloud Monitoring dashboard for Kibana is using the monitoring data that can get collected for every cluster that is running in Elastic Cloud. You can use it in the cluster that should be monitoring but its recommended using a separate monitoring cluster.
After enabling the monitoring data you also have access to the Stack Monitoring App within Kibana which already helps to get an good overview of the data. Those out of the box views are great to have a look in the collected metrics for Kibana, Elasticsearch, Elastic Agent and Elastic Enterprise Search. Unfortunately they are not very much focused on analyzing the logs.
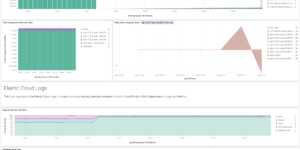
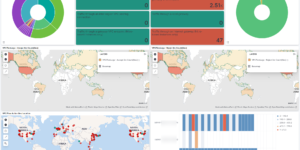
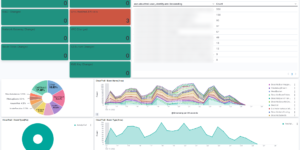
This Monitoring dashboard is therefore more focused on analyzing logs. It also provides a basic set of metric visualizations. If you think something is missing, pls contact me or put your request in the reviews section.
Per default Elastic only collects very basic logs. If you need to observe the logs more in detail, especially if you need to audit the system its better to also activate audit logging for Elasticsearch and Kibana. This can easily be done by changing the user settings within Elastic Cloud. You can also analyze the slow logs from Elasticsearch using this dashboard. But keep in mind that this is a more generic dashboard.. To get deep into Audit and Slow logs for Elasticsearch and Kibana its better to create dedicated dashboards for this purpose.
| Tested versions | 7.x, 8.x |
| ECS compliant | Yes |
You must log in to submit a review.