Elasticsearch Performance Troubleshooting Kit

Description

Improve the speed and efficiency of your Elasticsearch queries with the Elasticsearch Performance Troubleshooting Kit. This comprehensive toolkit is designed to help you identify and rectify causes of slow query performance in Elasticsearch. By providing an in-depth analysis of query execution, the kit enables you to pinpoint performance bottlenecks and implement effective solutions.

The toolkit comes equipped with practical guidance on understanding the detailed explanation of query performance, leveraging Elastic’s powerful features for optimizing query speed, and adjusting index strategies to enhance search performance. Dive into common troubleshooting areas such as shard overallocation, mapping explosions, and excessive use of scripts or heavy aggregations that can impede your Elasticsearch operation.

Also included are tips on optimizing your hardware and cluster configuration for peak performance, ensuring your Elasticsearch deployment runs smoothly. With the Elasticsearch Performance Troubleshooting Kit, users from developers to system administrators can gain valuable insights into their search infrastructure, leading to faster response times and a more efficient data search experience.

Download the toolkit now to embark on a path to optimal Elasticsearch performance, reducing latency in your searches and maximizing the overall effectiveness of your data querying capabilities.

Get more detailed info from: https://www.elastic.co/blog/troubleshoot-slow-Elasticsearch-queries

Source

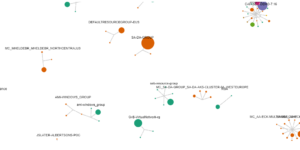
https://github.com/philippkahr/blogs/tree/main/apm-instrumentation-of-elastic-stack

Tested versions 8.x
ECS compliant Yes

You must log in to submit a review.

Related downloads

Office display canvas example

Kibana canvas example showing an office screen with weather, news and stock information

Azure billing data network

A vega visualization that shows the connection between resource group, resource type and the resource itself based on Elastic agent azure billing data integration.

Detection engine alerts overview dashboard

Average rating:

Kibana Canvas dashboard that shows an aggregated view on the results of the detection engine in Elastic Security.

Cloudflare Kibana dashboards

Cloudflare dashboards and ingest pipelines to visualize cloudflare logs

RUM extension dashboard

This dashboard provide deeper insight into the real user monitoring data collected by Elastic RUM.

Filebeat Suricata Canvas dashboard

A Kibana Canvas dashboard example that visualizes suricata logs collected with Filebeat.

These downloads could be also interesting for you

Threat detection Kibana dashboard

Kibana dashboard example visualizing the results of the Elastic SIEM detection engine

Watcher History Dashboard

This dashboard shows the history of executed watcher jobs.

Ask Me Anything Booth – Canvas Example

This is an example canvas page that shows how to visualize using canvas in general.

Data flow canvas

Average rating:

This canvas examples shows some possibilities of how to visualize data flows. Every flow can be activated / deactivated based on your Elasticsearch data.

Elastic Cloud Monitoring dashboard

Kibana dashboard that uses the Elastic Cloud monitoring data to provide better insights into what’s happening in your cloud environment.

Timetable canvas

This canvas examples shows timetable data from trains. Its build based on the real world information panel in german trian stations. Its refreshing based on current time.