Description
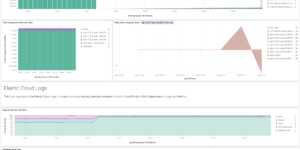
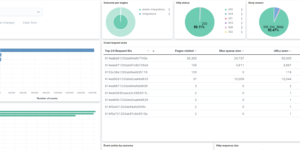
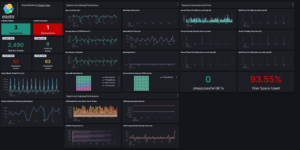
This Kibana dashboard uses many different Elastic integrations with the GCP platform in order to provide high grade of observability power. It combines GCP metrics like Compute and Storage metrics with GCP Audit, Firewall and VPC Flow logs.
Observe Google Cloud using Elastic is a very common use case especially in combination with monitoring other cloud providers as well. The beauty is that you can get all the necessary monitoring information in one single dashboard without using different tools.
In order to see data you need to use the GCP integrations using the Elastic Agent or the Google Cloud Dataflow templates from GCP console. To see the latest risks and alerts you need to activate the GCP related rules using the detection engine. The links in the dropdown menus to go to the OOTB single purpose dashboard provided by Elastic most likely need to get adapted to the IDs of those dashboards within your environment.
What is Google Cloud monitoring?
Google Cloud is a collection of cloud services delivered by Google. The Google Cloud Platform (GCP) is offering those services to the customer. It runs on the same infrastructure that Google is using for their end customer services like Google Search or Google Mail. GCP provides different kind of cloud based services like Infrastructure as a service, platform as a service and also serverless computing.
If your application is running on GCP infrastructure the challenge is to get a good overview about whether everything is running as expected. While GCP is offering internal tools to do this to some extend it very important to also observe logs and metrics with a dedicated solution like Elastic Observability.
How can the Google Cloud monitoring dashboard help?
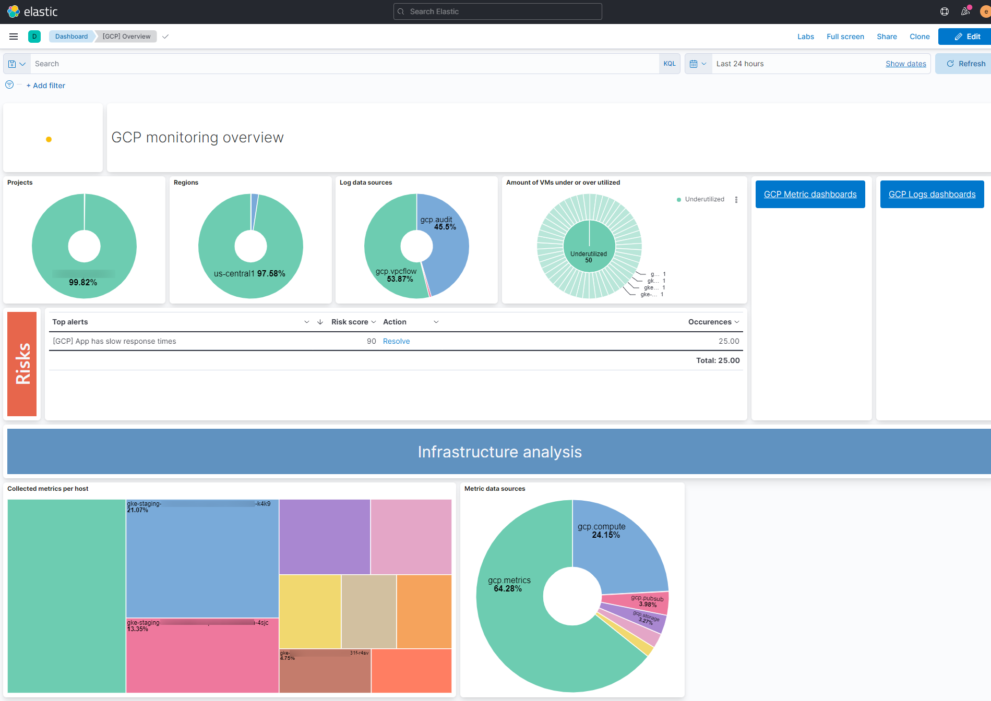
The Google Cloud monitoring dashboard you can download from Elastic Content Share helps by combining the results of Log and Metric Monitoring of all relevant Google Cloud and GCP resources / services. When using all relevant GCP integrations from Elastic you also get a big chunk of OOTB dashboards. However these dashboards are all made for a single service / data source and do not show the overall / high level picture. This target for this Google Cloud monitoring dashboard is to provide the high level view across different services.
| Tested versions | 7.x, 8.x |
| ECS compliant | Yes |
You must log in to submit a review.