Description
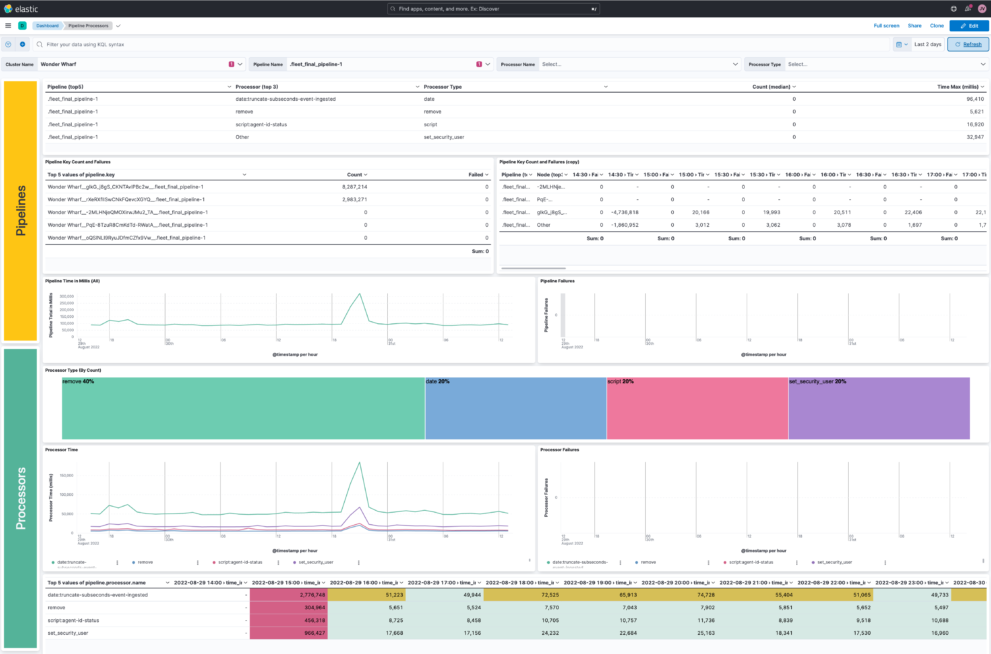
This download helps you to collect Elasticsearch ingest pipeline metrics and index them for monitoring.
Ingest pipelines let you perform common transformations on your data before indexing. For example, you can use pipelines to remove fields, extract values from text, and enrich your data.
A pipeline consists of a series of configurable tasks called processors. Each processor runs sequentially, making specific changes to incoming documents. After the processors have run, Elasticsearch adds the transformed documents to your data stream or index.
Being able to monitor those pipelines is an important part of to make sure that your Elastic Observability use case works fine.
What is Ingest Monitoring?
Ingest Monitoring in the ELK Stack is an important aspect of logging and data analysis. Ingest monitoring refers to the process of monitoring the input data that flows into the ELK Stack and ensuring that it is processed correctly.
There are several reasons why ingest monitoring is important in the ELK Stack:
- Data Integrity: Ingest monitoring helps to ensure the integrity of the data that is being processed by the ELK Stack. By monitoring the data as it flows into the system, any issues or errors can be quickly detected and addressed, ensuring that the data is accurate and reliable.
- Improved Performance: Ingest monitoring can help to optimize the performance of the ELK Stack. By monitoring the input data, it is possible to identify bottlenecks or slowdowns in the system, and make any necessary adjustments to improve performance.
- Troubleshooting: Ingest monitoring provides valuable information for troubleshooting any issues that may arise within the ELK Stack. By monitoring the input data, it is possible to identify the source of any problems, and take the necessary steps to resolve them.
- Real-Time Monitoring: Ingest monitoring allows for real-time monitoring of the input data, providing up-to-date information on the state of the ELK Stack. This enables organizations to quickly respond to any changes in the input data, and make any necessary adjustments to ensure the system remains functioning optimally.
- Improved Data Security: Ingest monitoring helps to ensure the security of the data that is being processed by the ELK Stack. By monitoring the input data, any potential security threats can be quickly identified and addressed, helping to protect sensitive information from unauthorized access.
In conclusion, ingest monitoring is an essential aspect of the ELK Stack, providing valuable insights into the input data and ensuring that it is processed correctly. By monitoring the input data, organizations can improve the performance of the ELK Stack, troubleshoot any issues that may arise, and ensure the security of their data.
Source: https://github.com/jeffvestal/ingest_pipeline_metrics
| Tested versions | 7.17, 8.2 |
| ECS compliant | No |
You must log in to submit a review.