Description
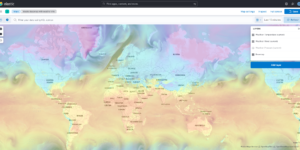
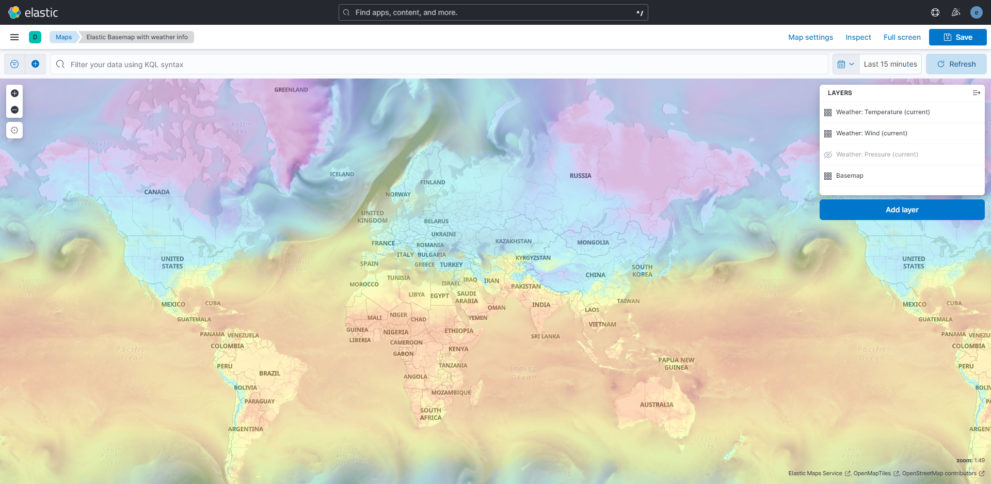
This visualization is a simple extension of the default map in Kibana. It has the Open Weather Map tile layers included to show Air pressure, Temperature and wind on top of the map.
This might be helpful as a starting point for any map visualization that could benefit from weather data. However it does not show the actual values. There is also no scale for the colors on the map. In order to get this done you need to place the map on a dashboard and add the scales as a separate visualization next to it.
There is no sign up necessary for Open Weather Map.
How can Kibana Map benefit from using Open Weather Map data?
Kibana Maps is a powerful visualization tool that can help organizations make sense of their geospatial data. By combining geospatial data with other types of data, such as weather data, Kibana Maps can provide even more insight and value to organizations. This can help to enhance data driven decision-making and gain a competitive advantage.
- Visualizing Weather-related Data Trends
One of the key benefits of using weather data in Kibana Maps is the ability to visualize weather-related trends. For example, if you’re a retail company with stores across the country, you can use Kibana Maps to visualize the correlation between sales and the local weather. If sales tend to be higher on sunny days, you can use this information to optimize your operations and allocate resources more effectively.
- Real-time Weather Monitoring
Another benefit of using weather data in Kibana Maps is real-time weather monitoring. With live weather updates, you can stay informed about the current weather conditions at any location, as well as make informed decisions based on the weather. For example, if a major storm is headed towards one of your store locations, you can take steps to prepare and ensure the safety of your customers and employees.
- Optimizing Logistics and Supply Chain Operations
Weather can also have a significant impact on logistics and supply chain operations. With Kibana Maps, you can monitor the weather in real-time and make decisions to optimize your operations. For example, if a snowstorm is headed towards a key shipping hub, you can adjust your shipping routes to ensure timely delivery of goods.
- Improving Customer Experience
Weather data can also be used to improve the customer experience. For example, if you’re a food delivery company, you can use Kibana Maps to visualize the correlation between weather conditions and delivery times. If delivery times tend to be longer during inclement weather, you can use this information to improve your operations and ensure that customers receive their food in a timely manner.
In conclusion, weather data can bring a wealth of valuable insights to organizations that use Kibana Maps. By combining weather data with geospatial data, organizations can gain a competitive advantage and make informed decisions that improve their operations and enhance the customer experience.
| Tested versions | |
| ECS compliant | Yes |
You must log in to submit a review.