Kibana Canvas examples
Demo

Description

Building a Canvas board is easy. Making it great is hard. To easy the creation of great Kibana Canvas dashboards I created this collection for you.

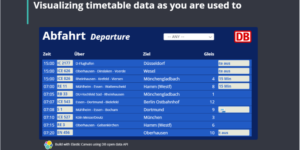
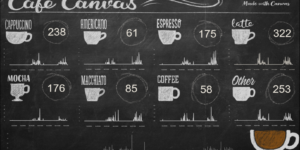
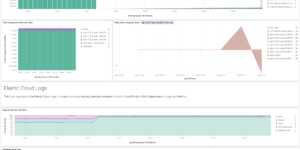
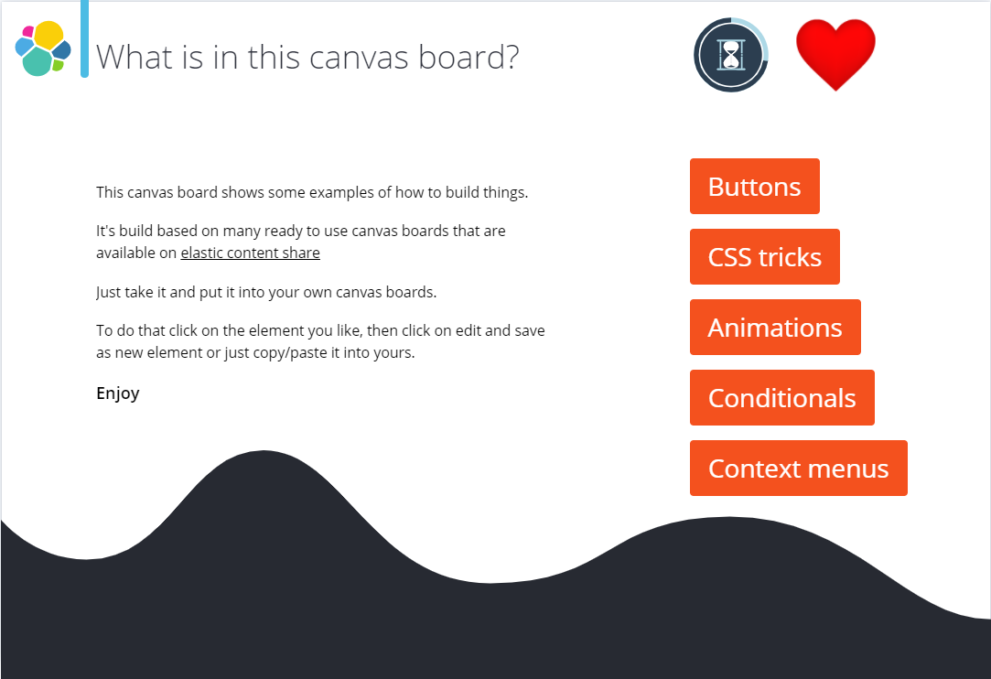
This Kibana canvas examples collection dashboard shows how to achieve common use cases with canvas. You only need to copy the dashboard into your environment then you can take the different elements. Afterwards copy / past the necessary elements into your environment.

The following things are covered:

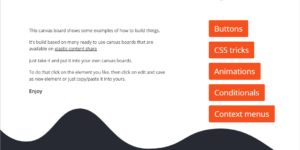
  • Creation and use of buttons using Markdown visualization
  • Creation and us of animations both using SVGs and CSS
  • Creation of tooltips, context menues and rich info popups
  • Creation of conditionals using if and switch / case statements
Tested versions 7.12
ECS compliant No

Reviews

  • Thank you

    Thats really a great canvas example. It helped me a lot!

    Thank you for your feedback.

    86 of 164 people found this review helpful.

  • You must log in to submit a review.

    Related downloads

    Kibana Canvas examples collection

    Average rating:

    A collection of canvas examples, like using conditionals, creating buttons, animations or context menues. Just copy paste into your Kibana Canvas project.

    Timetable canvas

    This canvas examples shows timetable data from trains. Its build based on the real world information panel in german trian stations. Its refreshing based on current time.

    Coffee Canvas Example

    Kibana Canvas example infographic to show coffee consumption on a wallboard

    Ask Me Anything Booth – Canvas Example

    This is an example canvas page that shows how to visualize using canvas in general.

    APM Services overview canvas

    Average rating:

    An adaptive turn key canvas example based on Elastic APM data.

    Office display canvas example

    Kibana canvas example showing an office screen with weather, news and stock information

    These downloads could be also interesting for you

    Elastic Cloud Monitoring dashboard

    Kibana dashboard that uses the Elastic Cloud monitoring data to provide better insights into what’s happening in your cloud environment.

    Data flow canvas

    Average rating:

    This canvas examples shows some possibilities of how to visualize data flows. Every flow can be activated / deactivated based on your Elasticsearch data.

    RUM extension dashboard

    This dashboard provide deeper insight into the real user monitoring data collected by Elastic RUM.

    Filebeat Log analysis canvas example

    This is a simple canvas dashboard example that analyzes logs created by Filebeat.

    Vega Scatterplot Kibana visualization

    A scatterplot visualization made with Vega Lite for Kibana

    Traffic light using Vega

    This traffic light visualizations is build with vega. The thresholds can be defined via values within the document itself.